The Illusion of Inflation: Why This Spring’s Numbers Will Look Artificially High
April 8, 2021
By Mike Konczal, J.W. Mason, Lauren Melodia
When inflation numbers come out on April 13, they will likely look very high. And measured annually, inflation will probably rise further over the next few months. These headline numbers will be used to argue against the American Jobs Plan and future infrastructure investments, and even to advocate austerity.
But this response will be wrong, for three reasons.
- The high year-over-year inflation of the coming months will reflect the falling prices of a year ago, whether or not prices are rising more rapidly today.
- Achieving the Federal Reserve’s price-stability goals requires a period of above-trend inflation; if inflation, correctly measured, rises modestly in the coming months, that’s a good thing.
- Even if inflation is a genuine problem, scaling back infrastructure investment is not the solution. It might even make the problem worse.
Wait, what?
Inflation is the change in the price level. So if the price level doesn’t change, how can inflation rise?
The reason for this seeming paradox is that inflation is typically reported as the change over the past year. That means that the measured inflation rate depends not just on what prices are doing now but what they were doing a year ago. Most of the time, with the economic situation changing smoothly and gradually, this doesn’t make much difference. But changes a year ago, as we all remember, were anything but slow and gradual.
Starting in March 2020, the pandemic and the restrictions imposed to deal with it drastically reduced demand for many services. The resulting falls in the prices of these services, and the even deeper fall in energy prices, led to a drastic slowing of inflation; between March and May of last year, the US actually experienced a rare occurrence of deflation.
Those falling prices a year ago mean that the base from which annual inflation rates are now being calculated is smaller—which is why annual inflation is going to appear to rise steeply over the next few months, even if inflation today remains unchanged or even falls.
Starting April 13, and continuing for the next several months, what is in effect an optical illusion is going to seriously distort inflation numbers as they are normally reported, and opponents of more public spending will be quick to pounce.
Anyone who wants an objective assessment of economic reality, either in reporting or policy conversations, will need to correct for this distortion. If a seemingly big spike in year-over-year (YoY) inflation is misunderstood as a sign of rising prices today rather than of falling prices a year ago, debates over the American Jobs Plan and future infrastructure proposals could go off the rails.
Higher Inflation Numbers Don’t Necessarily Mean Inflation Is Higher
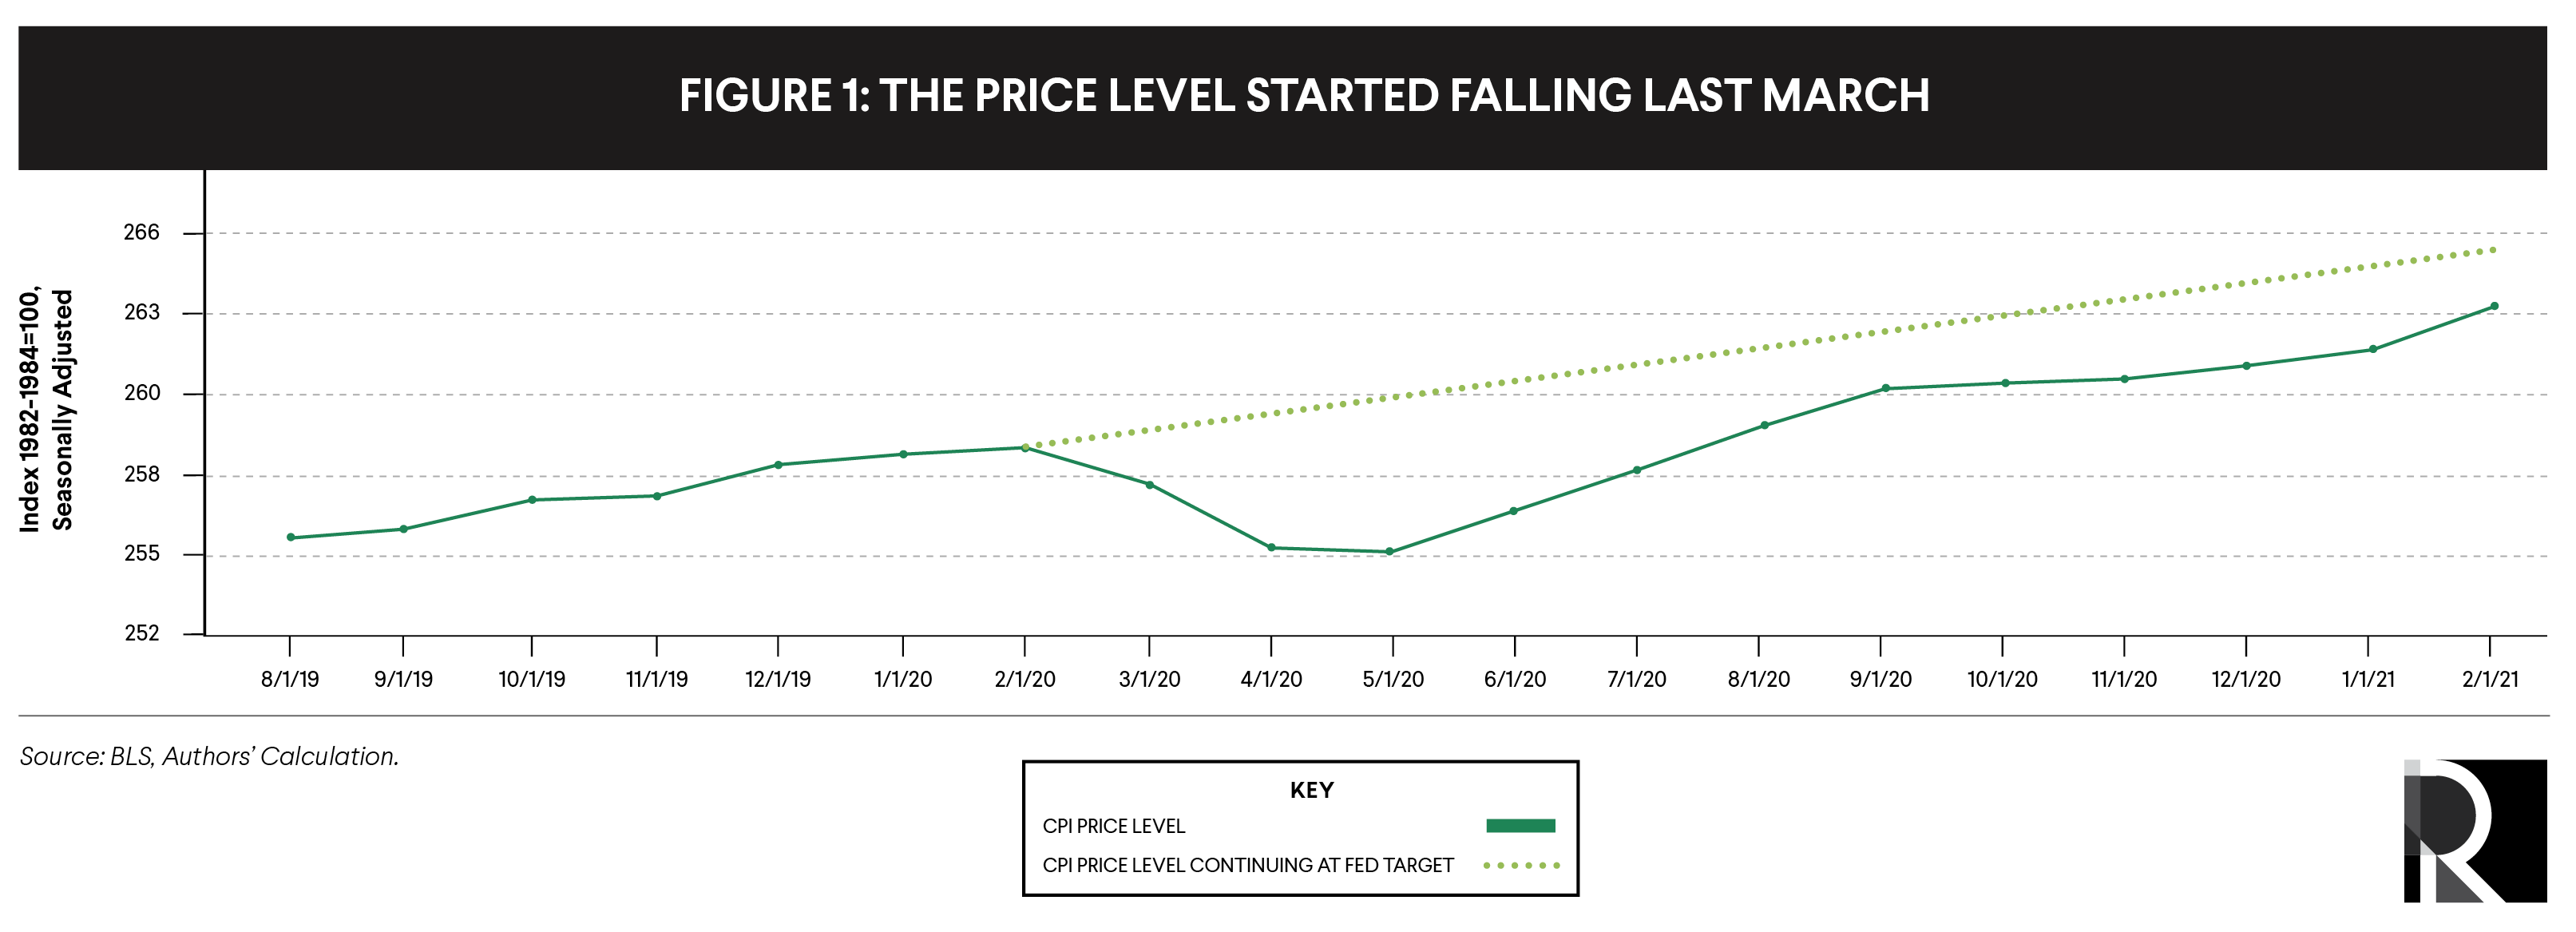
The baseline illusion will first appear next Tuesday, April 13, when the Bureau of Labor Statistics releases its Consumer Price Index for the month of March. (The same dynamic will be repeated later in the month when the Bureau of Economic Analysis releases the Personal Consumption Expenditures Price Index.) Starting then, and for the next several months, the conventional YoY measures of inflation will be comparing today’s prices to those of the depression-level COVID lockdown, when official unemployment was near 15 percent. You can see the spring 2020 drop clearly in Figure 1: As late as July 2020, the price level was lower than it had been at the start of the year.
As a result, movements in headline inflation numbers over the next few months will be dominated not by changes in prices today but by the much larger changes of a year ago.
The annual inflation rate will look high on paper, but what it is really showing us is deflation in 2020, not inflation in 2021.
To get a sense of the bias this will introduce, consider the extreme example in which there is no inflation at all for the next several months, meaning that the price level is exactly the same in March through May as it was in February. As we see in Figure 2, if prices remain constant, inflation over the past year would rise to 2 percent for March, 2.7 percent for April, and 2.8 percent for May. Even though prices are not increasing at all in this scenario, the YoY metric will still show rising prices, driven entirely by the fall in prices that happened last year. The annual inflation rate will look high on paper, but what it is really showing us is deflation in 2020, not inflation in 2021.

Alternatively, consider the scenario in which the Federal Reserve is hitting its symmetric inflation target of 2 percent inflation as measured by the personal consumption expenditure price index (PCE).1 Since the PCE tends to rise about half a point slower than the consumer price index (CPI), this translates to a 2.5 percent annual increase in the CPI. With the CPI rising at a 2.5 percent annual rate, YoY inflation would be 2.2 percent for March, then 3.1 percent for April, then 3.5 percent for May. Inflation would look surprisingly high and growing, even though the actual behavior of prices would be exactly in line with the Fed’s target.
Somewhat Higher Inflation Is Just Part of a Strong Recovery
What can we do to ensure that policy debates don’t get derailed by illusionary inflation?
To start, we can acknowledge that this is a good problem to have. If we see large price increases relative to the deflationary period of a year ago, that means that the spring declines in prices and incomes have not been locked in.
The apparent rise in inflation over the next few months is one sign of a rapid bounce-back from the recession—something we have not experienced in recent downturns. Thanks to the American Rescue Plan, incomes are rising rapidly enough to make up for the fall they experienced last year, promising a stronger recovery than we’ve seen in a generation. There was no apparent spike in inflation after the similar fall in prices during the 2008–2009 financial crisis, not because the Fed did a good job hitting its inflation target but precisely because it failed to do so, with the period of outright deflation followed by years of below-target inflation.
Recognizing that an apparent spike in inflation is a necessary result of a strong recovery doesn’t solve our data problem, though. If YoY inflation isn’t a meaningful metric right now, what should we be looking at?
One possibility would be to look at a shorter period—the change over the past month, or past quarter. This would avoid the optical illusion of using the lockdown period as a baseline. The drawback is that monthly and even quarterly price data is noisier than annual data—with more random variation that doesn’t tell us anything about the state of the economy.
A more sophisticated and economically meaningful approach would be to look at the trend since some period before the pandemic—February 2020 or earlier.
Looking at inflation this way has the advantage of not only avoiding the baseline illusion but being more consistent with the way the Federal Reserve thinks about inflation. The Fed has been clear that it sees its inflation target as a symmetric goal for average inflation over the long term. This means that periods with below-target inflation should be followed by above-target inflation. As Fed Chair Jerome Powell concluded in an August speech announcing the Fed’s new strategy, “therefore, following periods when inflation has been running below 2 percent, appropriate monetary policy will likely aim to achieve inflation moderately above 2 percent for some time.”2
Under this approach, the relevant question is not the change in prices over the past year or some other period but whether the level of prices is above or below where it would have been if inflation had consistently been 2 percent.
In this framework, the target today should not be a steady 2 percent inflation rate, but a rise in prices fast enough to make up for past shortfalls—at least the shortfall of the pandemic, and arguably the shortfall of the previous decade-plus of mostly below-target inflation as well.
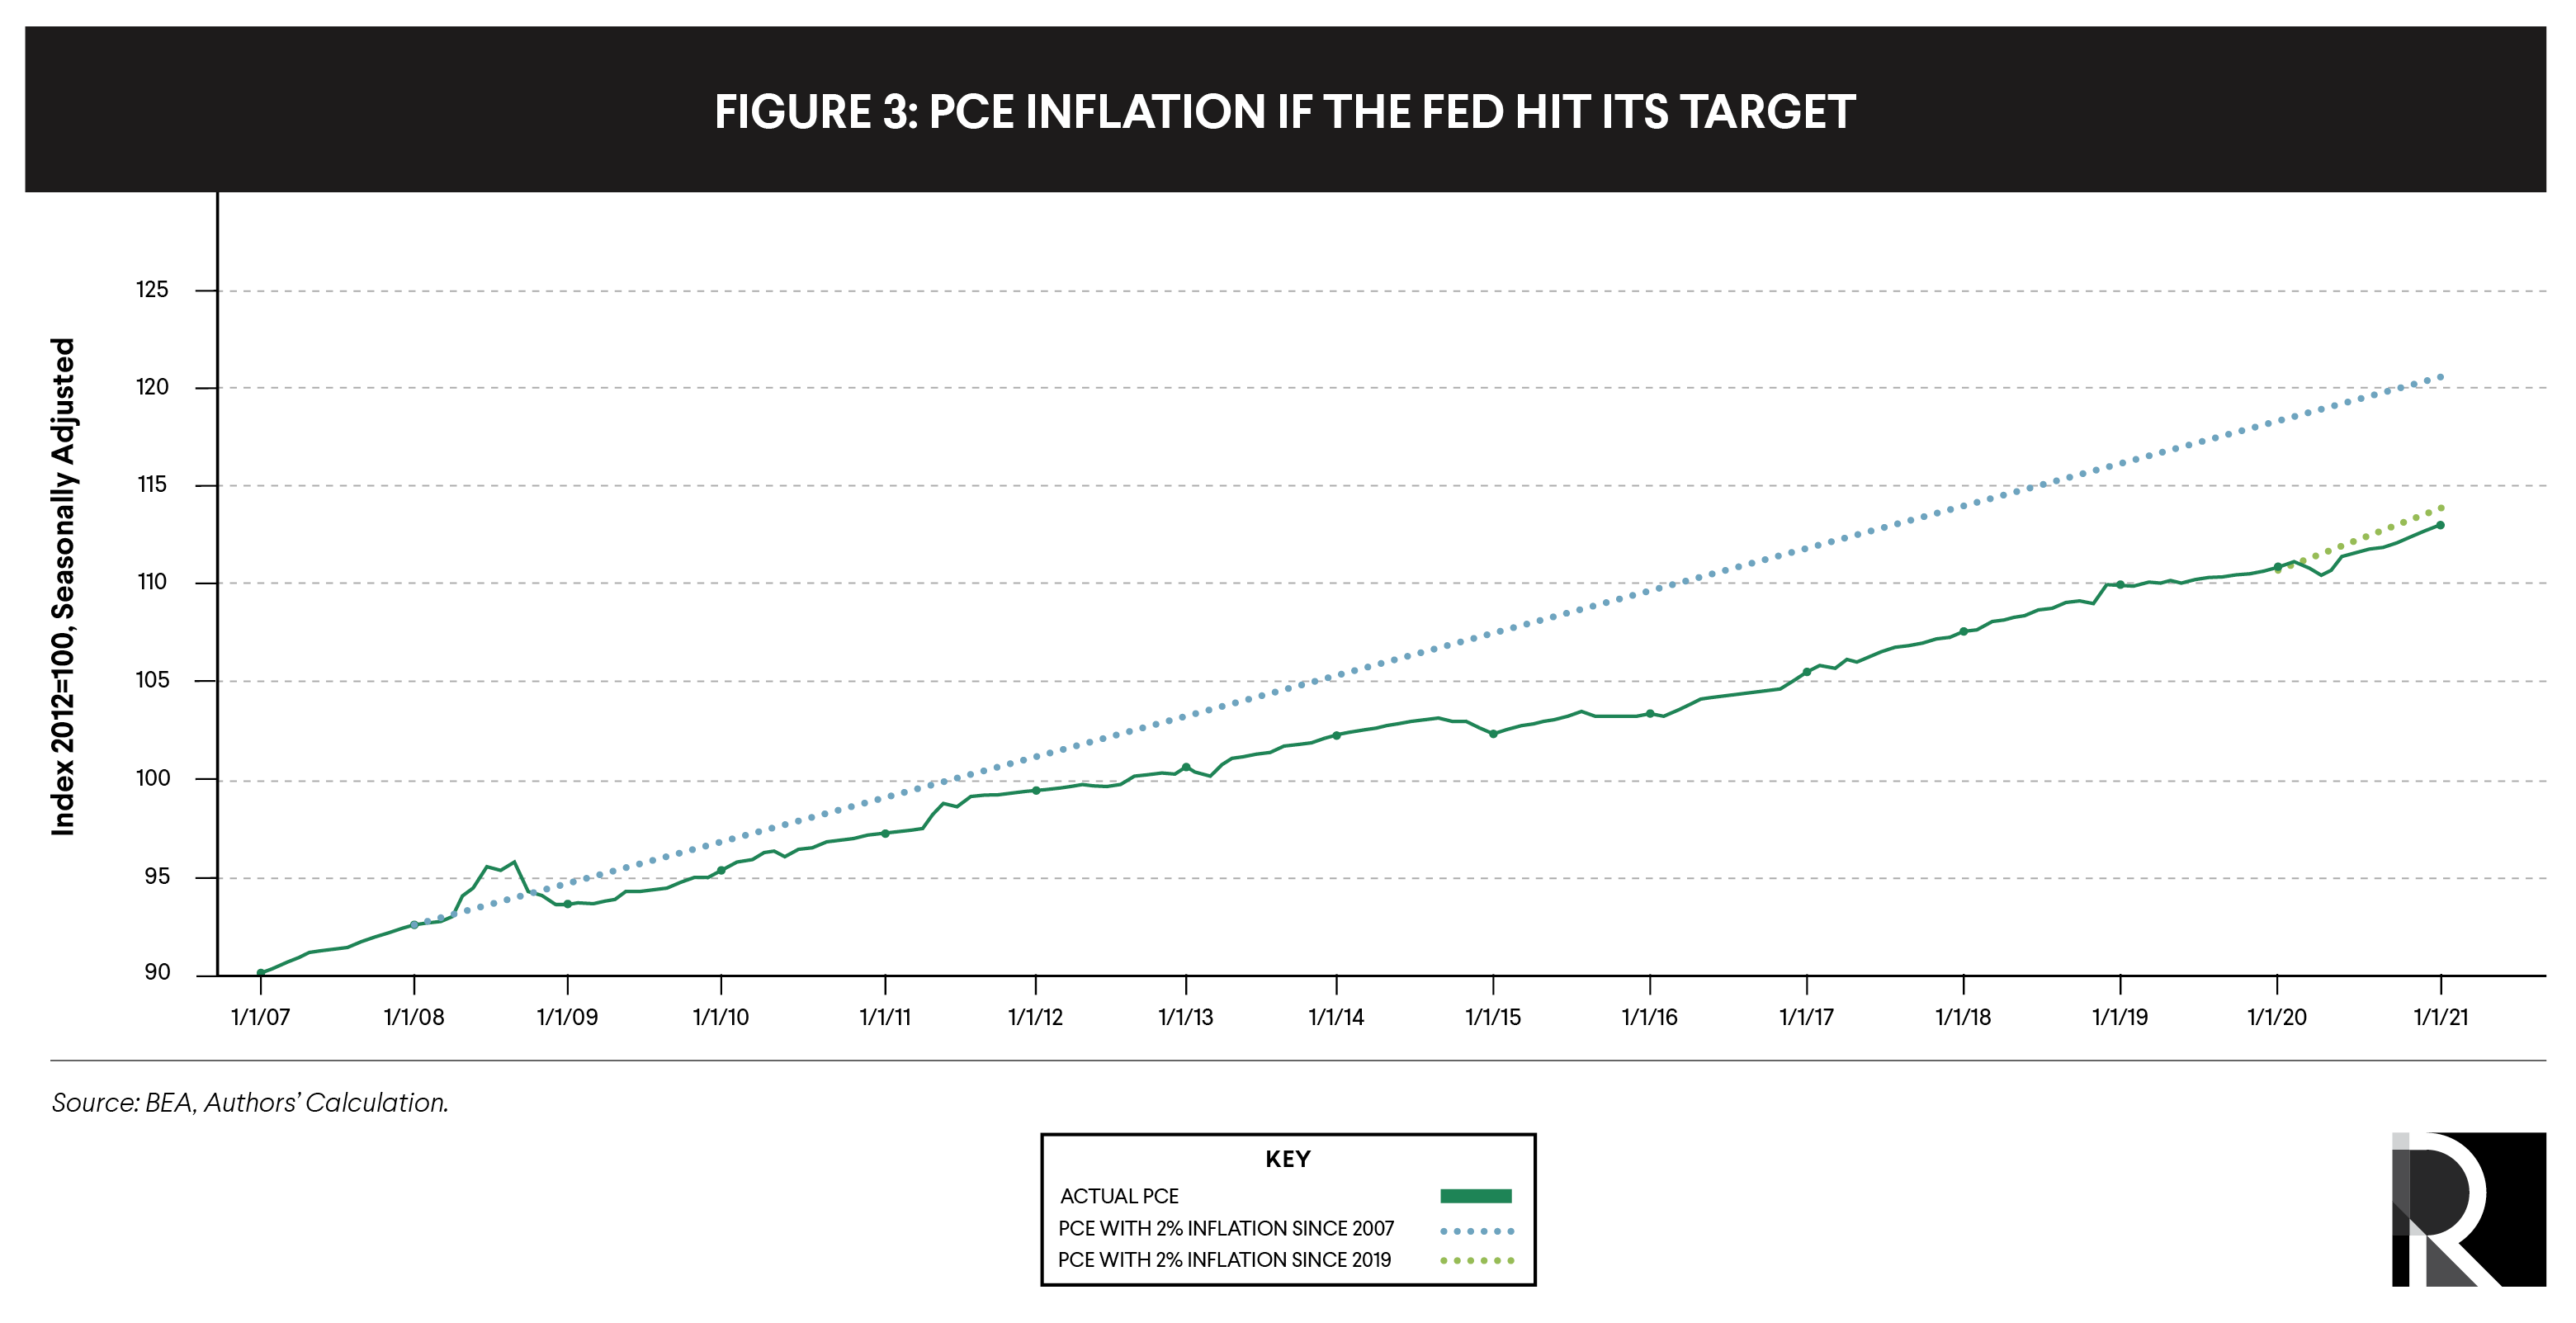
Figure 3 shows the actual price compared with two hypothetical levels with 2 percent inflation—one starting from the pre-pandemic level at the start of 2020, and the other from the end of 2007, just before the Great Recession. As of February, the price level is about half a point below the first trend and 7 points below the second. This suggests that meeting the Fed’s new standard will require a period of greater than 2 percent inflation, even after correcting for the baseline illusion.
For reporters and policymakers, probably the simplest measure would be to look at the average inflation rate since the start of 2020. This would avoid the distortions created by mechanically applying the annual change to the period that includes the pandemic deflation, without departing too far from established practice. But it’s important to understand that even this may be too conservative, given the chronic undershooting in the decade before the pandemic.
In any case, the key point is that we should be comparing the level of prices to where it would be if the inflation target had been consistently met, as opposed to the change over some period that we are used to looking at.
If Inflation Is a Problem, Spending Less Is Not the Solution
So far, this has all been about measurement. Measurement is important—especially when it comes to inflation, which is a tricky statistical problem. But there is also a substantive question: What if prices do actually rise rapidly over the next couple months? What does that tell us about the state of the economy, and what is the appropriate response to it?
The orthodox view of inflation is that the economy’s productive capacity, or potential output, rises slowly and steadily, as the labor force grows and technology improves. The flow of spending in the economy (aggregate demand) varies much more erratically, so any mismatch between them—as reflected in higher or lower inflation—normally reflects shifts in demand. It follows that if inflation is too high, the solution is to reduce demand, typically by raising interest rates, or else by cutting public spending and raising taxes. In the current context, high inflation will certainly be used as an argument for curtailing the ambitions of the American Jobs Plan.
But we should be cautious about applying this orthodox framework to the debate over the recovery and the infrastructure bill, for a couple of reasons.
First, the pandemic and lockdown affected both production and spending. During the spring, the decline in spending was bigger and faster—that’s why we experienced deflation, rather than the inflation some had feared. But with spending roaring back thanks to the American Rescue Plan, the pandemic’s effects on supply may now be more important. With incomes recovering and restrictions lifting, there is likely to be a massive increase in the kinds of spending that were curtailed for most of the last year—travel, food service, live entertainment, and so on. It’s quite possible that, in the short run, capacity in these sectors will have trouble keeping up with demand, and prices may rise. But these kinds of short-term sectoral adjustments are very different from an across-the-board overheating. In particular, rather than build up momentum as generalized inflation sometimes does, these adjustment-related price increases will die down by themselves once businesses are fully reopened and operating normally.
More broadly, it’s not clear why a mismatch between aggregate demand and supply must always be dealt with by tamping down demand. Why shouldn’t the response instead be to raise supply? Imagine a city where rising housing costs were a problem. Would a better response be one, to try to make the city less appealing to new residents, thus reducing demand, or two, to look for ways to boost the housing supply? Most people would presumably say option two. But macroeconomic policy has been organized as if the right answer was obviously option one.
Increasing potential output may be easier said than done, of course. But to the extent that the supply constraints and rising prices are coming from specific bottlenecks that public action can plausibly relieve, that should be taken seriously as an option instead of assuming that the only solution is to spend less.
When we look at inflation today, we don’t see prices rising uniformly throughout the economy. Rather, we see big increases in specific areas—health care, education, housing—that reflect specific issues in those sectors at least as much as economy-wide supply constraints. Cutting spending across the board is unlikely to do much to slow price increases in these areas; controlling the prices of things like education and health services requires targeted measures that are likely to call for more public spending rather than less.
And when we look at the specific spending envisioned in the American Jobs Plan, much of it seems well-targeted to increase the economy’s productive potential and loosen supply constraints. (That’s more or less what infrastructure means.) Transportation, broadband, and utilities are inputs to almost every kind of business, so investment in these areas will raise productivity across the board. Lowering electricity bills, or speeding delivery times by moving passenger traffic from cars to transit, will eventually reduce costs and prices throughout the economy. Research and development spending promises bigger productivity gains in the targeted industries.
Less obvious but perhaps even more important is the role of investment in the care economy. By making it easier for people who currently do unpaid work caring for children and other dependents to choose paid employment if they wish, these measures could substantially increase the potential labor force.
Today, the burden of this unpaid work falls mainly on women, limiting their opportunities to engage in paid work. Prior to the pandemic, employment rates among women in their prime working years were a full 10 points below those of men of the same age, a gap that has not appreciably narrowed in the past 20 years. This is a long-standing difference, exacerbated by the COVID-19 pandemic, but it’s not fixed by nature. The gender gap in employment is substantially smaller in virtually every other rich country. With funding for childcare and home care, there is every reason to think the American Jobs Plan could boost women’s labor force participation rates substantially, which would help relieve any inflationary pressure.
It would be a sad irony if concerns about demand overshooting the economy’s productive capacity prevented exactly the kinds of public investment that could raise that capacity.
Conclusion
When inflation numbers come out on April 13, they will likely look very high. And measured annually, inflation will probably rise further in the next few months. These headline numbers will be used to argue against the American Jobs Plan and future infrastructure investments, and even to advocate austerity.
But this response will be wrong, for three reasons. First, the high YoY inflation of the coming months will reflect the falling prices of a year ago, whether or not prices are rising more rapidly today. Second, achieving the Fed’s price-stability goals requires a period of above-trend inflation; if inflation, correctly measured, rises modestly in the coming months, that’s a good thing. And third, even if inflation is a genuine problem, scaling back infrastructure investment is not the solution. It might even make the problem worse.
1 The PCE and CPI are two slightly different measures of the level of consumer prices. While many public discussions of inflation focus on the CPI, the Federal Reserve’s 2 percent inflation target is based on the PCE. Inflation as measured by the PCE is lower than CPI inflation, generally by around 50 basis points. But since both price indexes experienced similar falls in the spring of 2020, the points in this post apply to inflation measured either way.
2 This is not a new idea. Already in the 1990s, for example, Federal Open Market Committee (FOMC) members observed that hitting 2 percent inflation on average required that “for every recession you treat yourself . . . to a little overheating, because that is what it will take to keep the average inflation rate constant.” But it’s only under Powell that this view has become official Fed policy.
Authors

Mike Konczal
Former Director, Macroeconomic AnalysisAs former director of Roosevelt’s macroeconomic analysis team, Mike Konczal led research focused on achieving full employment, building an economy that truly works for everybody, and developing the next generation of economic ideas.

J.W. Mason
Senior FellowJ.W. Mason is a senior fellow at the Roosevelt Institute and economist with the macroeconomic analysis team. His focus is on public spending and government debt, finance and monetary policy, and the importance of strong demand and full employment. He also works on trade policy, corporate finance, and decarbonization.

Lauren Melodia
Former Deputy Director, Macroeconomic AnalysisLauren Melodia is the deputy director of economic and fiscal policies at the Center for New York City Affairs at The New School. Prior to joining the Center, she worked at the Roosevelt Institute, providing research and data analysis on the COVID-19 economic recovery, inflation, and fiscal and monetary policy at the national level.