Why Economic Data Revisions Mean Better Statistics
February 3, 2025
By Michael Madowitz
Friday is Jobs Day, and it will be weird. On February 7, we will get the first Employment Situation release of the Trump administration, reporting the last data from the Biden administration. The Labor Department uses two different surveys—one of households and one of businesses—to report the real-time health of the job market each month, and we will also get significant revisions to data from the past year in the business survey. The revisions make the odds of confusion quite high for the uninitiated each February, but—given how unnecessarily confusing so many things are right now—it’s worth taking a moment to reflect on why incurring some temporary confusion, in this case, contributes to the universally respected economic statistics that are central to the long-term stability of the US financial system.
Federal statistics on the US economy are timely, accurate, free and accessible to all, independent from political influence (for now), and extremely well documented. The breadth and quality of US economic data is one reason markets have so much trust in the US financial system, keeping borrowing costs low. Timeliness and accuracy are usually competing objectives in statistical surveys (and in life!), but statistical agencies strike a balance by releasing the best estimates possible as fast as possible and regularly updating these estimates.
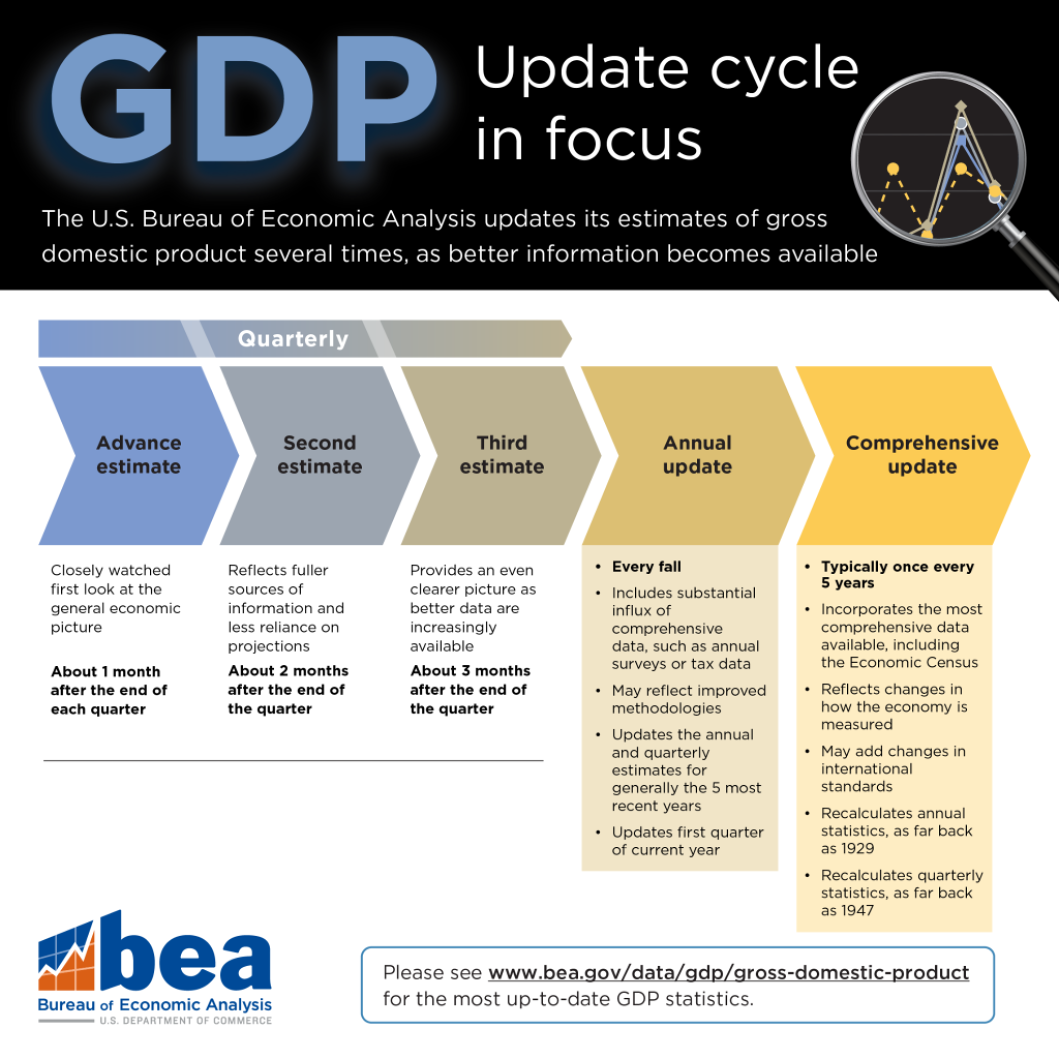
For example, each quarterly GDP estimate is released and revised as more data become available to improve these estimates. The timeliest Advance Estimate is released weeks after the end of each quarter, followed by the Preliminary Estimate a month later and the Final Estimate a month after that. Beyond the quarterly cycle, annual revisions update the previous five years of data each fall, and the entire history of US GDP back to 1947 is revised roughly every five years—to adopt more advanced methods in future data and make the historical record consistent.
Jobs numbers are released monthly, with data from the Current Population Survey of 60,000 households used to estimate employment and unemployment rates—these data are not revised. Payroll employment is estimated from the Current Employment Statistics survey of over 600,000 establishments each month. These data are revised for two months after initial release as additional survey responses come in, enabling a more precise estimate. Each January, revisions for businesses are made again, largely because the population of businesses is less stable than the population of people. To estimate economy-wide employment from a sample of businesses requires an estimate of the entire population of businesses—which comes from the colorfully named “birth-death model” for businesses and results in January’s benchmark revisions.
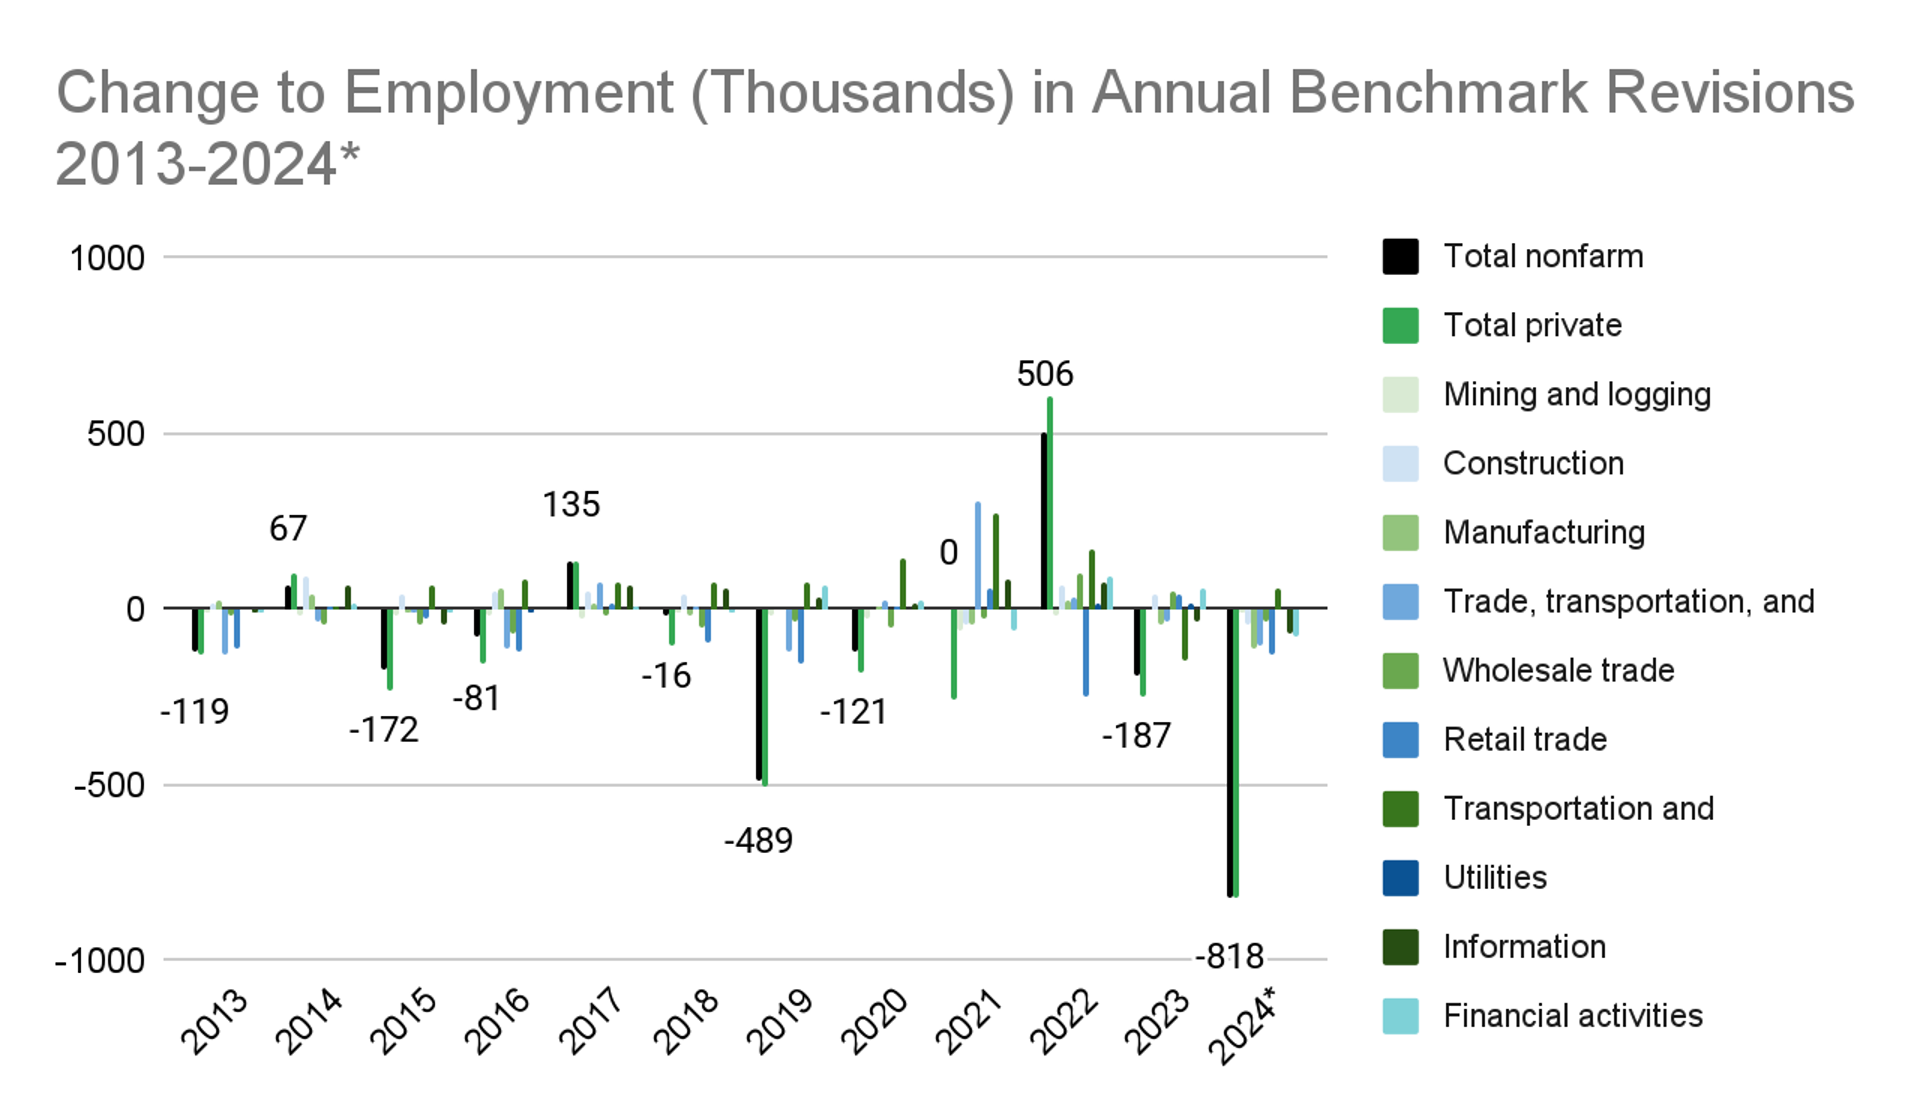
The January report that will be released Friday is likely to show household counts go up, since higher immigration numbers likely pushed up both population and economic growth, even as we’ll probably see the number of businesses fall. Though it’s difficult to forecast revisions to the business survey, a preliminary release of one month of data showed the number of jobs contracting by about 800,000 as of March 2024. The most likely outcome, then, is revisions that say both that the number of people employed is higher than we thought and that businesses hired fewer people than we thought. Confusing, but the confusion is in service of accuracy!
Of course, having a statistical agency that shows its work is a privilege. These revisions are likely to be large, but they are a sign that statistics are being collected and published faithfully and agencies are being transparent about previous misses. Economic debates are important, but they couldn’t happen constructively without good measurements we can all rely on. Just take a breath before diagnosing this month’s data, and be wary of self-appointed experts spotting conspiracies—they definitely pop up, even people who should know much, much better.
Author