Shareholders First: What Hasn’t Changed since the Business Roundtable’s 2019 Statement
August 19, 2020
By Chirag Lala, Lenore Palladino
On August 19, 2019, the Business Roundtable (BRT) released its “Statement on the Purpose of a Corporation,” which committed signatories to supporting their communities, investing in employees (and fairly compensating them), dealing fairly with suppliers, and protecting the environment. In this blog post, we look at financial data from BRT members—America’s leading corporations—to see if the statement marked a change in how CEOs choose to spend corporate profits. We find that, despite rhetoric about a renewed focus on stakeholders, CEOs continued to prioritize paying shareholders and taking on debt in late 2019 and early 2020. [1]
Signed by 181 of America’s leading corporate executives, the statement purported to represent a sea change in corporate governance, from an exclusive commitment to “shareholder value” to a “stakeholder” approach. In its 1997 “Statement on Corporate Governance,” the BRT stated that “the paramount duty of management and of boards of directors is to the corporation’s stockholders; the interests of other stakeholders are relevant as a derivative of the duty to stockholders.” The 2019 statement changes course, stating that BRT members “share a fundamental commitment to all our stakeholders . . . Each of our stakeholders is essential. We commit to deliver value to all of them, for the future success of our companies, our communities and our country.”
One year later, the question remains as to whether the senior executives signing these statements have altered their behavior. To answer that question, we examine publicly available corporate financial data to see if their newly professed commitment to stakeholders is reflected in how they spend their money. Did the signatory firms begin an appreciable shift away from prioritizing shareholder payments through stock buybacks and dividends and new long-term debt? Before answering this question, it is worth exploring what shareholder primacy is and why the BRT signaled a shift away from it.
The Harms of Shareholder Primacy
The ideology of shareholder primacy is that “shareholders have rights to the profits created through corporate activity, based on the economic theory that a corporation is simply a ‘nexus of contracts’ and that shareholders are the only stakeholder group within the firm taking the kinds of risks that deserve a variable reward” (Palladino 2020b, 11; Jensen and Meckling 1976). This thinking has numerous flaws: First, corporations are creatures of the public domain and can be subject to public regulation on their activities, disclosure responsibilities, and forms of reimbursement to financiers and shareholders. Second, a diverse set of stakeholders take risks by engaging with the firm and being tied to its activity—and first among equals are employees. Third, households have diversified assets held by asset managers and often lack incentive to pay attention to management decisions, while their stock purchases never actually transfer funds to the firm because they occur on a secondary market (Palladino 2020b) (Lazonick 2017).
The ideology of shareholder primacy has meant that corporate executives choose to spend billions of dollars on stock buybacks and dividends to benefit shareholders and management, who are largely paid in stock, while wages for nonsupervisory workers have stagnated for decades. Between 2010 and 2019, publicly traded corporations spent $6.3 trillion on stock repurchases, peaking at nearly $847 billion in 2018[2]; this represents a massive lost opportunity for spending on paid sick leave, retained earnings, or living wages (Palladino 2020c). Meanwhile, the share of labor compensation in GDP fell from its 1970 peak of 64.9 percent to 59.7 percent in 2017 (“Share of Labor Compensation” 2020). Emphasizing shareholder returns puts upward pressure on stock valuations, especially when paired with compensation to executives in the form of stock options (Palladino 2020b). It also increases the likelihood of insider share-selling as executives take advantage of regulatory loopholes to profit from induced increases in their firm’s stock price (Palladino 2020a).
The corporate focus on maximizing shareholder value is a prime driver of wealth inequality (Batty et al. 2019). In 2019, the top 10 percent of households held 87 percent of corporate equity, up from 80 percent in 1989 (Palladino 2020b, 13). The top 1 percent of households saw their share of corporate equity increase from 39 to 50 percent in the last three decades (13). Palladino (2020b) disaggregated Compustat S&P data to calculate total shareholder payments going to white, Black, and Latinx households. Between Q1 2004 and Q2 2019, white households received $13 trillion in total shareholder payments (14). Black households received $181 billion, and Latinx households received $212 billion over this same period (14). For both Black and Latinx households, the gap in ownership of corporate equities contributes significantly to the overall asset ownership gap between white households and households of color. By late 2019, corporate equities accounted for a near-historic peak of 22 percent of the asset gap for Black households and 23 percent for Latinx households.[3] Black and Latinx households respectively own $378 and $487 billion in corporate equities, while white households own $23 trillion (15).
Unfortunately, the policy response to the COVID-19 pandemic missed an opportunity to put a stop to massive shareholder payments. While the CARES Act temporarily banned stock buybacks and dividends by recipients of direct loans or loan guarantees from the Treasury, it placed no restrictions on companies receiving other forms of support from the Federal Reserve or on companies that generally benefited from reduced borrowing costs because of the Federal Reserve’s interventions. Numerous firms, including signatories to the BRT statement, have gone ahead with dividend hikes; Johnson & Johnson, Procter & Gamble, and Northrop Grumman are among them (Springer 2020).
Analysis of BRT Member Activity
Now, we examine whether the BRT’s statement from August 2019 actually signifies a new way of doing business. We look here at data from the disclosure statements these firms filed with the Securities and Exchange Commission before and after the statement (though prior to the onset of the pandemic) to assess whether the signatories made choices signaling a renewed commitment to all their stakeholders.
It does not appear that they did. Key variables such as long-term debt and stock buybacks remain on their previously increasing trend. Unfortunately, it is not possible to analyze changes in labor compensation, as companies are not required to disclose total labor compensation, and most nonfinancial corporations choose not to.
Key Trends in Corporate Decision-Making
To begin, we review a few key summary statistics over the universe of the firm signatories: 181 of the largest and best-known companies in the United States. For each variable, we take the average across firms each quarter for the years 2009–2020. The following trends are readily visible:
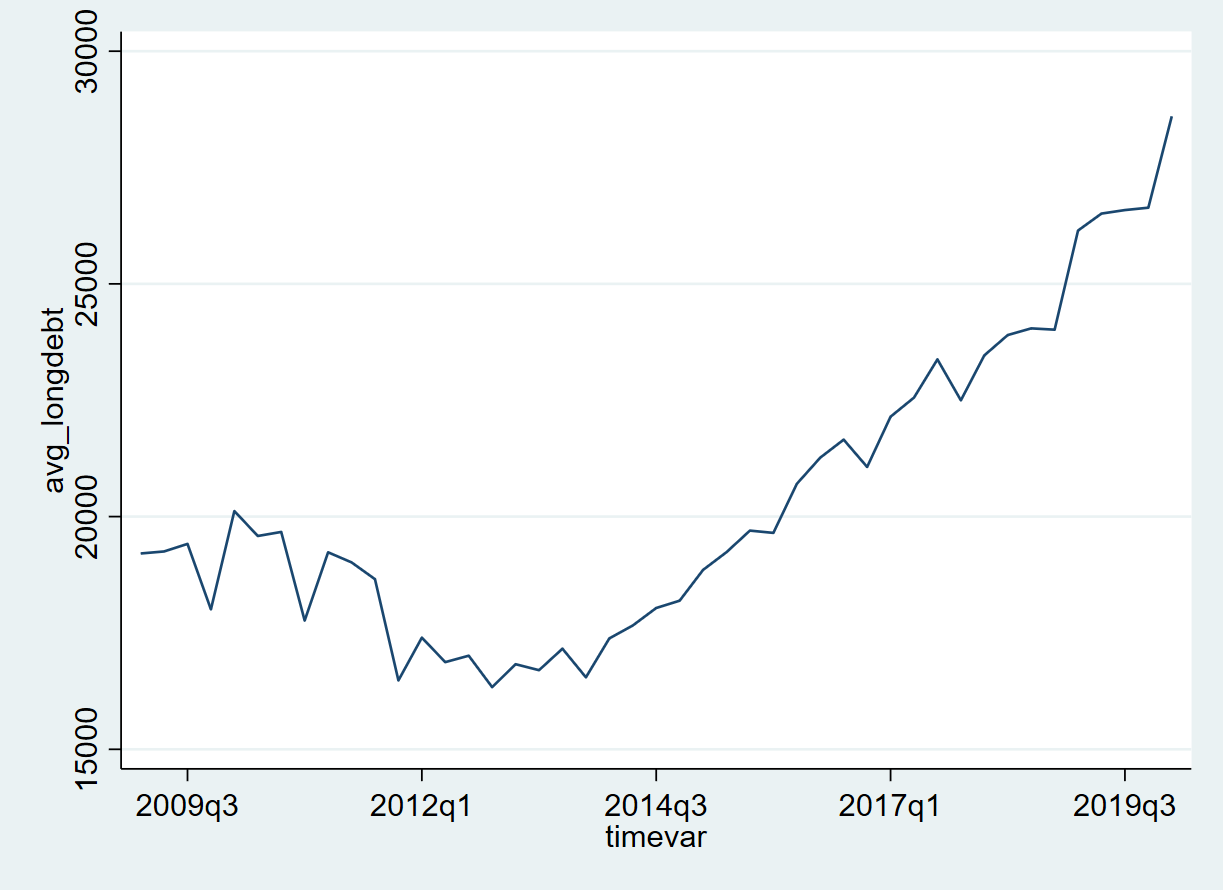
- Long-term debt among these firms rose continuously throughout the past decade.
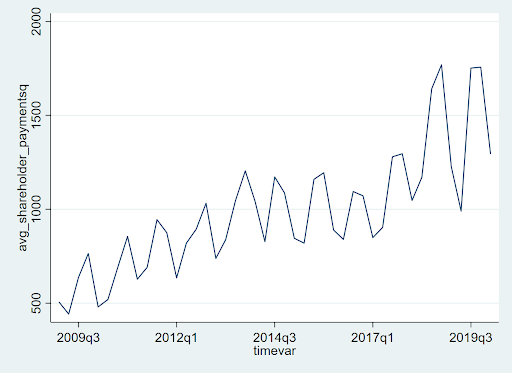
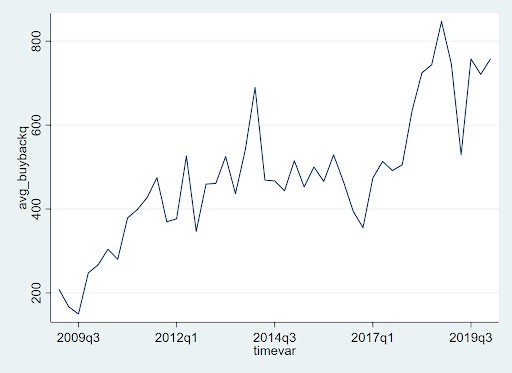
- Shareholder payments rose through the decade, driven primarily by the rise in stock buybacks.
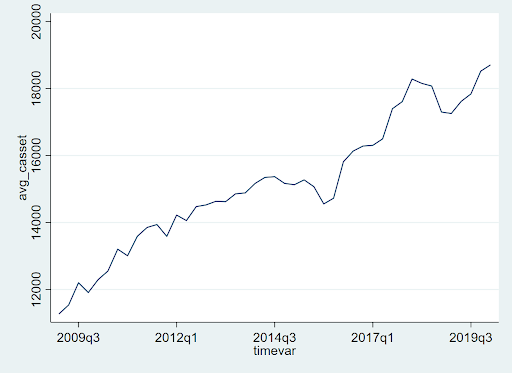
Holdings of cash assets display a secular increasing trend throughout the past decade as well.
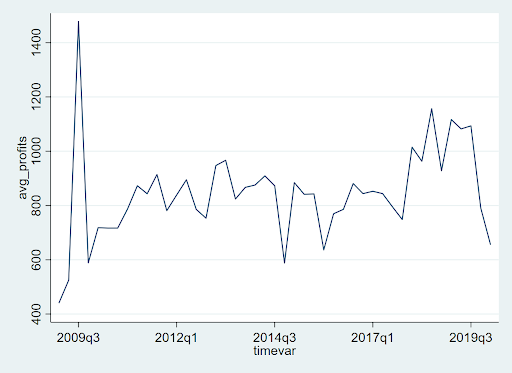
Profits (shown below) are the most difficult to gauge. Following a large spike in the aftermath of the Great Recession, they fluctuated well in the black through the decade and ended with a sudden fall beginning in Q4 of 2019.
In sum, we find that three key indicators of corporate behavior—long-term debt, stock buybacks, and holdings of cash assets—continued to strengthen and stay on their previous trends even after the August 2019 BRT statement.
Assessing Key Corporate Finance Ratios
In order to examine how the variables move together, we create a series of ratios of our key variables, demonstrating executive priorities—shareholder payments and long-term debt—as a ratio of assets.
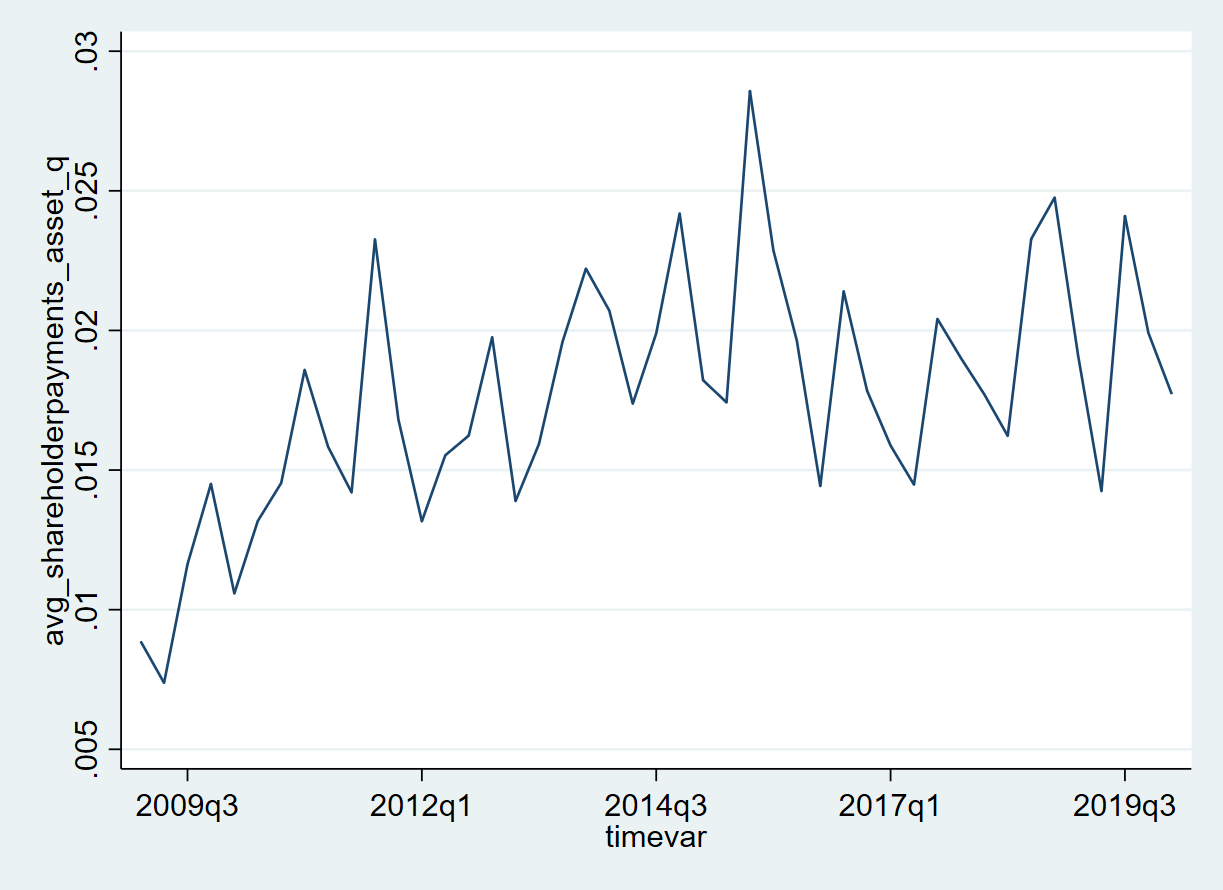
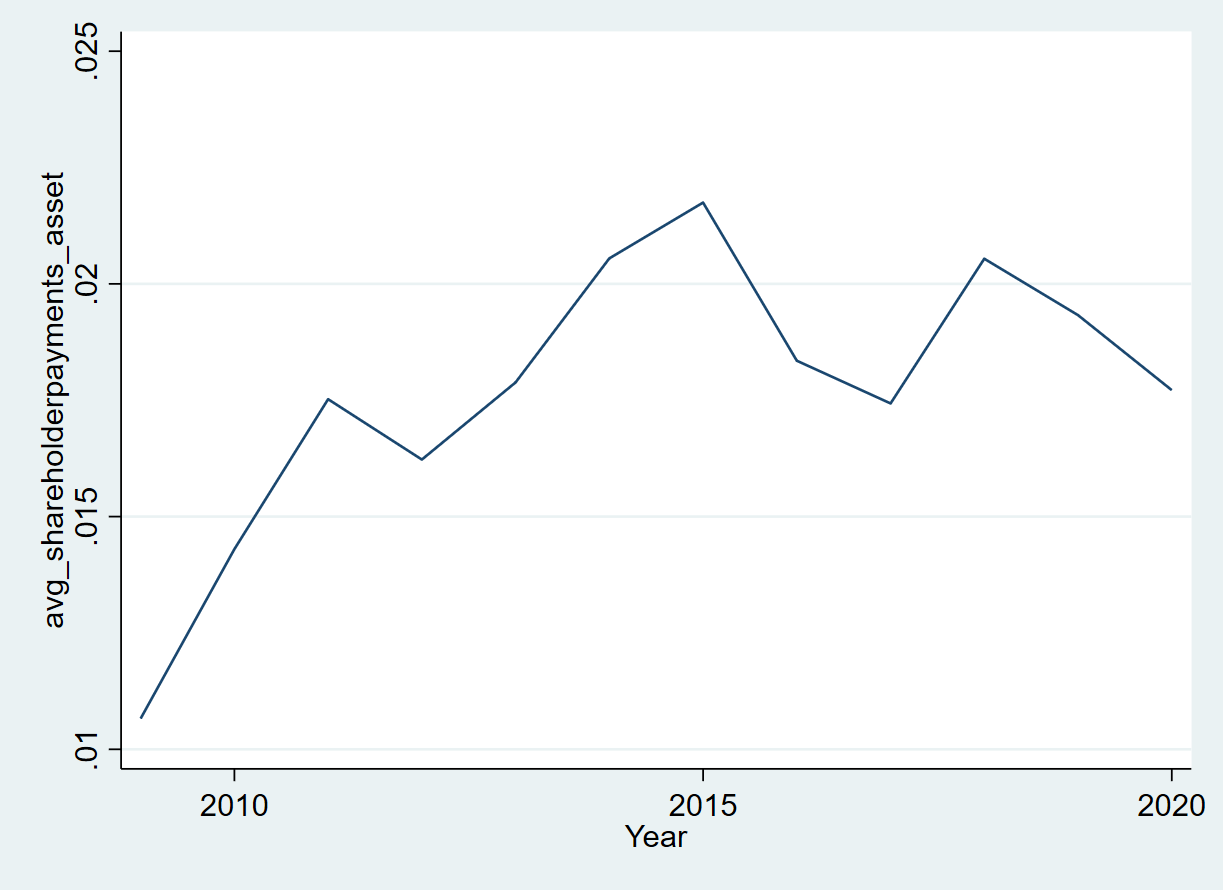
Let’s begin with shareholder payments. Below, we depict shareholder payments across firms as quarterly ratios of assets and annualized quarterly averages over assets. They display a steady increase in their quarterly averages despite significant volatility over the decade. The trends most closely reflect the steady rise in stock buybacks, as dividends are too volatile to record significant trends without reliance on annual averages. Though the BRT statement was issued in August 2019, shareholder payments increased slightly in the fourth quarter, and stock buybacks actually increased as a ratio of assets through the first quarter of 2020.[4]
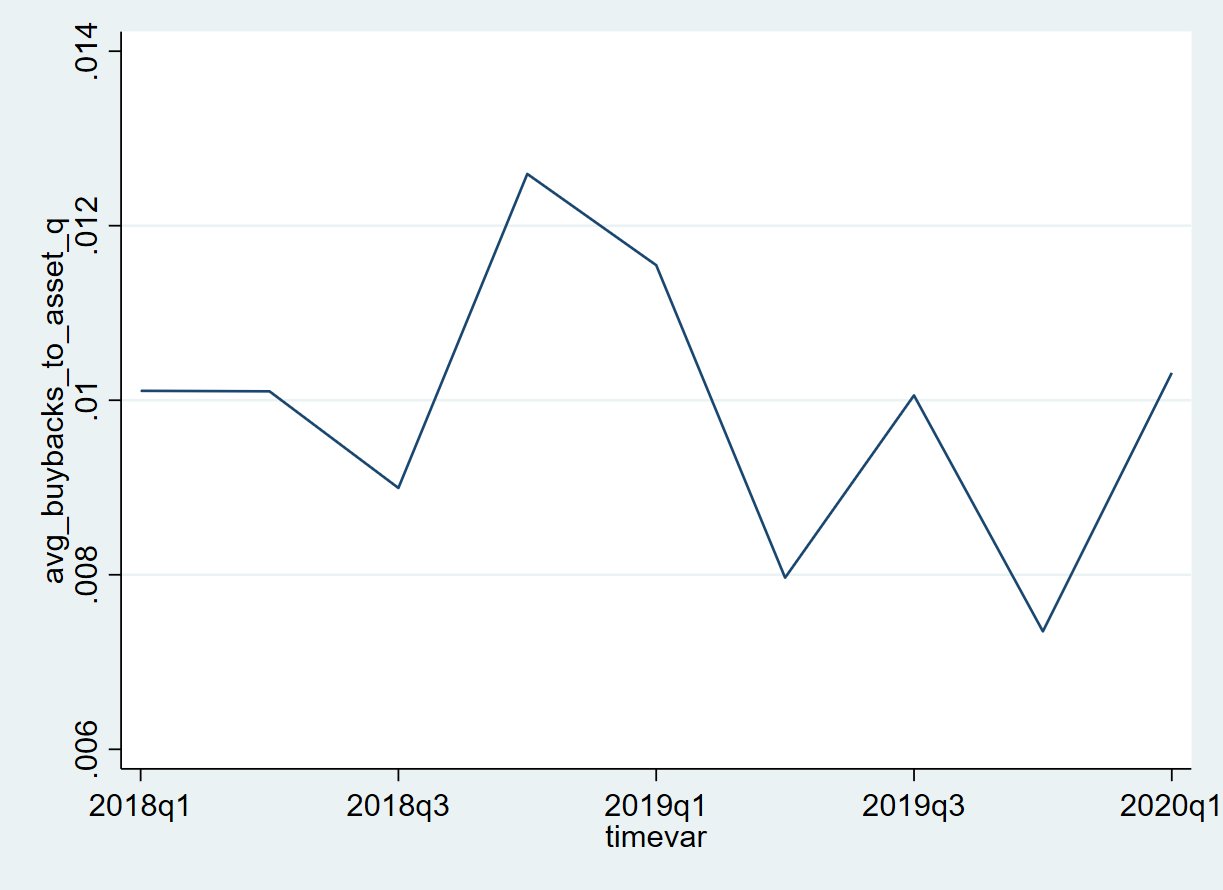
Despite a commitment not to focus exclusively on shareholders, stock buybacks (expressed as a ratio of assets) were at the same level in early 2020 that they had been in early 2018 and 2019.
Long-term debt continued an upward trend right through the first quarter of 2020.
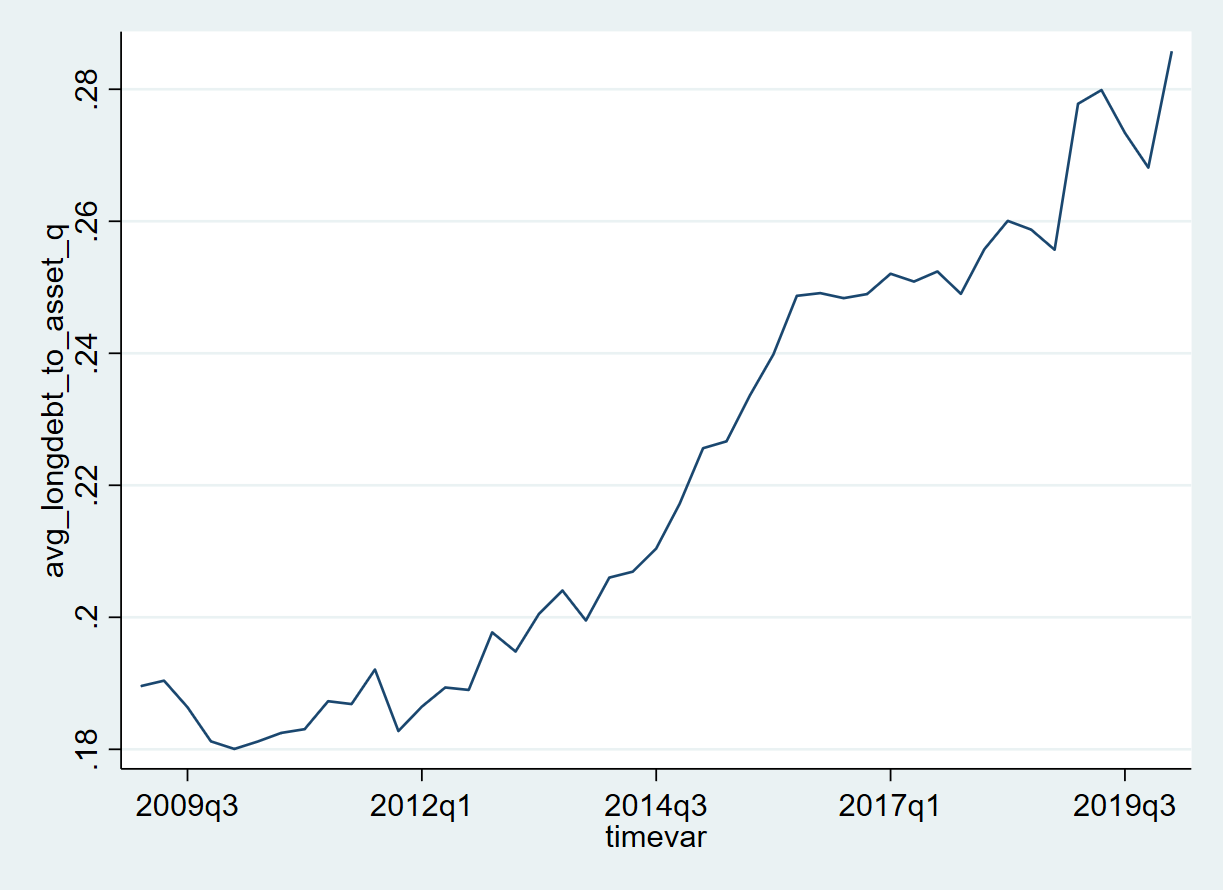
This analysis shows that the strong focus on manipulating stock prices through stock buybacks and racking up long-term debt continued through the 2010s, and stayed steady even as BRT leaders professed a change in course. These figures suggest that relying on public statements and a change of heart by America’s CEOs will not be enough to reorient corporate decision-making away from shareholder primacy. Instead, public policy reforms will be required to rebalance power inside America’s largest businesses and ensure that all corporate stakeholders truly benefit from the value they create.
[1] As described below, I examine data for the first quarter of 2020, largely before the onset of the COVID-19 pandemic.
[2] We calculate buybacks as the sum of the multiplication of common shares repurchased and repurchase price.
[3] See Figure 1.
[4] See Figure 5.
References
Batty, Michael, Jesse Bricker, Joseph Briggs, Elizabeth Holmquist, Susan McIntosh, Kevin Moore, Eric Nielsen, et al. 2019. “Introducing the Distributional Financial Accounts of the United States.” Finance and Economics Discussion Series 2019 (017). doi:10.17016/feds.2019.017.
Jensen, Michael C., and William H. Meckling. “Theory of the Firm: Managerial Behavior, Agency Costs and Ownership Structure.” Journal of Financial Economics 3, no. 4 (1976): 305-360.
Lazonick, William. “The Functions of the Stock Market and the Fallacies of Shareholder Value.” Corporate Governance in Contention (2017): 117-151.
Palladino, Lenore. 2020a. “Do Corporate Insiders Use Stock Buybacks for Personal Gain?” International Review of Applied Economics 34, no. 2: 152–174.
Palladino, Lenore. 2020b. “The Contribution of Shareholder Primacy to the Racial Wealth Gap.” Roosevelt Institute Working Paper. Roosevelt Institute.
Palladino, Lenore. 2020c. “The Lost Opportunity in Buyback Spending.” Roosevelt Institute, April 1, 2020.
“Share of Labour Compensation in GDP at Current National Prices for the United States.” Federal Reserve Economic Data. Accessed July 22, 2020.
Springer, Lisa. “21 Dividend Increases Announced During the COVID Crisis.” Kiplinger, July 3, 2020.