Real Wages Are Increasing for Those in the Bottom Half of the Income Distribution
November 17, 2021
By Joana Duran-Franch, Mike Konczal
Between roughly 56 and 57 percent of occupations, largely concentrated in the bottom half of the income distribution, are seeing real hourly wage increases.
As nominal wages are growing rapidly alongside higher-than-expected inflation, there has been significant interest in the evolution of real wages—wages adjusted for inflation—during the recovery from the COVID-19 pandemic. A headline in the New York Times, for example, asks: “Wages Are Rising, but Can They Keep Up with Inflation?” One important piece of this question is how real wages have changed along the wage distribution—that is, how are real wages changing for workers who earn the least? This question is difficult to answer accurately given the dramatic changes in the composition of employment during this period. However, in looking at two different estimates of real wage growth by occupations, we find that between roughly 56 and 57 percent of occupations, largely concentrated in the bottom half of the income distribution, are seeing real hourly wage increases. Those occupations represent between 64 and 65 percent of total employment. Real wages, therefore, are increasing for a majority of the population, especially for those who need it the most.
The Challenges of Analyzing Wages during Recessions
It can be difficult to analyze wages during recessions because of composition effects—how the composition of the workforce changes. As the Council of Economic Advisors discussed in April, lower-wage workers are more likely to lose their jobs during recessions, which happened during the pandemic. This causes average wages to increase during the downturn, as lower-wage workers no longer bring down the average. By the same dynamic, lower-wage workers gaining new jobs will also drag down average wage growth during the recovery. This effect can be quite large, making results inaccurate and difficult to examine.
In our analysis, we address composition effects by using occupations as the unit of analysis, as the composition of the labor force within an occupation is less likely to have changed as dramatically as in the whole economy. However, even within the context of an occupation, composition effects might still be playing a role. For this reason, we first look at both real wage growth from September and October 2019 to September and October 2021, and then at wage growth in those same months in 2020 to 2021. The first exercise will examine real wage growth from before the pandemic; as such, the compositional effects will likely be driving up the values, making it a higher boundary of wage increases. The second, starting from within the high unemployment environment of late 2020, will show results where the compositional effects will exert downward pressure on average real wages as more workers return to work. Since the compositional problem will exaggerate these results to be too high and too low, respectively, the most likely answer to this question will be between them.
Real Wage Changes since before the Pandemic
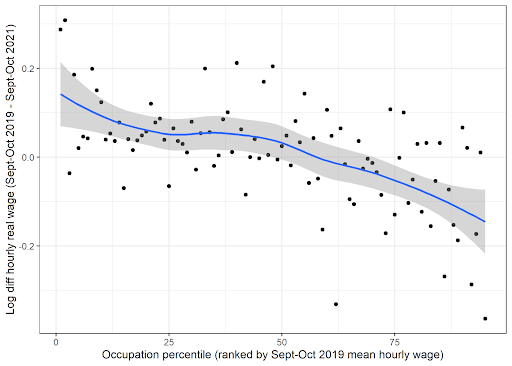
In this first exercise, we rank occupations by their log real hourly wage in September and October 2019 and calculate the change between September and October 2019 and September and October 2021 in each percentile of the real hourly wage distribution. This exercise includes wage information for 367 detailed occupations encompassing all US nonfarm employment. The results are shown below.
Figure 1. Hourly Real Wage Changes by Occupational Percentile, September and October 2019–2021.

Despite rising inflation levels, this shows that real wages are growing at the lowest end of the wage distribution compared to pre-pandemic levels. Relative to the same period in 2019, in September and October 2021, average real wages were higher in most occupational percentiles at the bottom of the wage distribution. Out of the 367 occupations for which there is information both in September 2019 and 2021, 209—57 percent—have seen real mean wage gains over this period. These occupations represented 65 percent of all nonfarm employment in September and October 2021. The average real wage growth for the bottom half of the occupational wage distribution was 6.1 percent over these two years.
Real Wage Changes since Fall of 2020
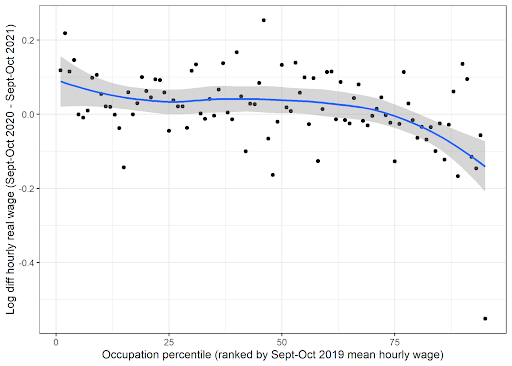
Our findings are similar in the second exercise, using September and October 2020 as the base. This is despite (i) 2020 being a period of high wages due to composition effects (those who left the labor market during the pandemic were disproportionately lower wage workers); and (ii) September and October 2020 to September and October 2021 being a period in which composition effects added downward pressure on wages as more workers have reentered the labor market.
Figure 2. Hourly Real Wage Changes by Occupational Percentile, September and October 2020–2021.

Relative to the same period in 2020, in September and October 2021, average real hourly wages were higher in most percentiles at the bottom of the wage distribution. Out of the 349 occupations for which there is information available, 196—56 percent—have seen real mean wage gains over this period. These occupations represented 64 percent of all nonfarm employment in September and October 2021. The average wage growth for the bottom half of the occupational hourly wage distribution was 1.4 percent over the last year.1
In both figures above, only the lower 95 percent of the wage distribution is represented in the graphic (but the entire range is kept for the analysis). Due to sampling error and the fact that wages are top-coded for incomes higher than $150,000, we believe the information related to this part of the distribution in this dataset is not capturing reality appropriately. For this reason, we exclude it from the representation. Moreover, many of the larger negative values near the top end of the occupational distribution reflect sampling error on high-wage occupations; that said, the general direction of wages, positive through the middle then negative near the top end, is robust to multiple monthly specifications.
In time, we’ll have better and more accurate data to answer these questions. But the progressive distribution of these wage increases follow what has been found by the Atlanta Fed’s Wage Growth Tracker as well as in analysis of worker wage data by economists Arindrajit Dube and Aaron Sojourner, who also find that real wages are increasing most for those at the bottom of the income distribution. Adding to these, our two exercises also point to real wage growth at the bottom of the income distribution and, by trying to address the compositional effect through occupations, note that a slight majority of workers are likely benefitting from real wage gains during the pandemic and its recovery. As we see, even with a period of higher-than-expected inflation, real hourly wages are increasing for those who most need a raise in our economy.
