Clean Supply Chains: An Opportunity to Usher in a New Generation of Place-Based Strategies for Economic Development
November 22, 2022
By Sunny Malhotra, Todd N. Tucker*
We are in an industrial policy moment: Over the past few months, trillions of dollars in public investments in supply chains, infrastructure, and green energy have been unlocked. These are already benefiting communities across the United States due to new laws such as the Inflation Reduction Act (IRA), the CHIPS and Science Act, the Infrastructure Investment and Jobs Act (IIJA), and the American Rescue Plan Act (ARPA), as well as greater use of executive authorities like the Defense Production Act (DPA).
These new laws are not merely an alphabet soup of random initiatives; rather, they add up to a fundamental shift away from neoliberalism. While the former neoliberal consensus was agnostic about whether or not clean energy products were built in the US by union workers and left it up to the market to decide, a new paradigm asserts that elite market actors acting alone will not build the industries we need in the regions where we need them. Just as the military industrial complex was built on having defense jobs or dollars felt in every congressional district, the political durability of the green economic transition requires a similar attention to economic geography. While the old consensus adopted an austerity orientation that taxpayer dollars should never be expended to promote activities that private finance is willing to fund, the new ethos is premised on the notion that our nation does not lack investment resources. Those resources are just being hoarded at the top of the income distribution and can be regained through progressive taxation. Public dollars play a qualitatively distinct role from private capital and can ensure that economic development not only happens, but can be democratically shaped to reflect the broader public interest.
Which places are currently well positioned to benefit from this new place-based strategy? To begin to answer this question, we constructed a new data set based on 874 pages of reports from a yearlong investigation by the Department of Energy (mandated by the White House) into the economic vulnerabilities for clean energy supply chains brought on by globalization. We conducted a close qualitative analysis of these reports to match potential economic opportunities along these supply chains to specific places in the US that are currently or were recently producing specific component inputs needed for clean energy production—from specialized minerals for large-capacity batteries, to glass for solar panels, to turbines for hydropower. (See below for further description of our methodology).
In total, we identified 208 economic opportunities critical to 11 clean supply chains. The vast majority of these involve opportunities for both blue-collar and white-collar workers in sectors like manufacturing, mining, and research. (Indeed, only 17 percent of these opportunities appear to be limited to white-collar, corporate office work.) These opportunities correspond to 53 different component industries spread across 44 states and 141 congressional districts across the country. In all, 166 distinct firms are involved in these supply chains. Notably, despite complaints by trading partners that US industrial policy disadvantages their industries, US-operating firms with ownership from at least 21 countries are included in these opportunities.
Our findings suggest that a wide range of communities across the country stand to benefit from clean supply chain investments through existing and future legislation. But, as we note in our methodology, these 208 opportunities are only the tip of the iceberg—many more states and localities can get in on the action. Further research should focus on whether or not the current geography of these supply chains is optimal from an economic, environmental, and equity standpoint, and what openings exist to bring an even more diverse array of places into an abundant clean energy future.
Figure 1 is an interactive map, in which each dot has information about the supply chain and subcomponent of each opportunity, as well as the congressional district in which it is located.
Figure 1: Map of US Clean Energy Supply Chain Opportunities
Source: Authors’ analysis of Department of Energy supply chain reports.
Table 1 lists the 11 supply chains and their subcomponent industries, with counts of the number of facilities producing each item.
Table 1: Number of US Facilities Producing Clean Energy Components
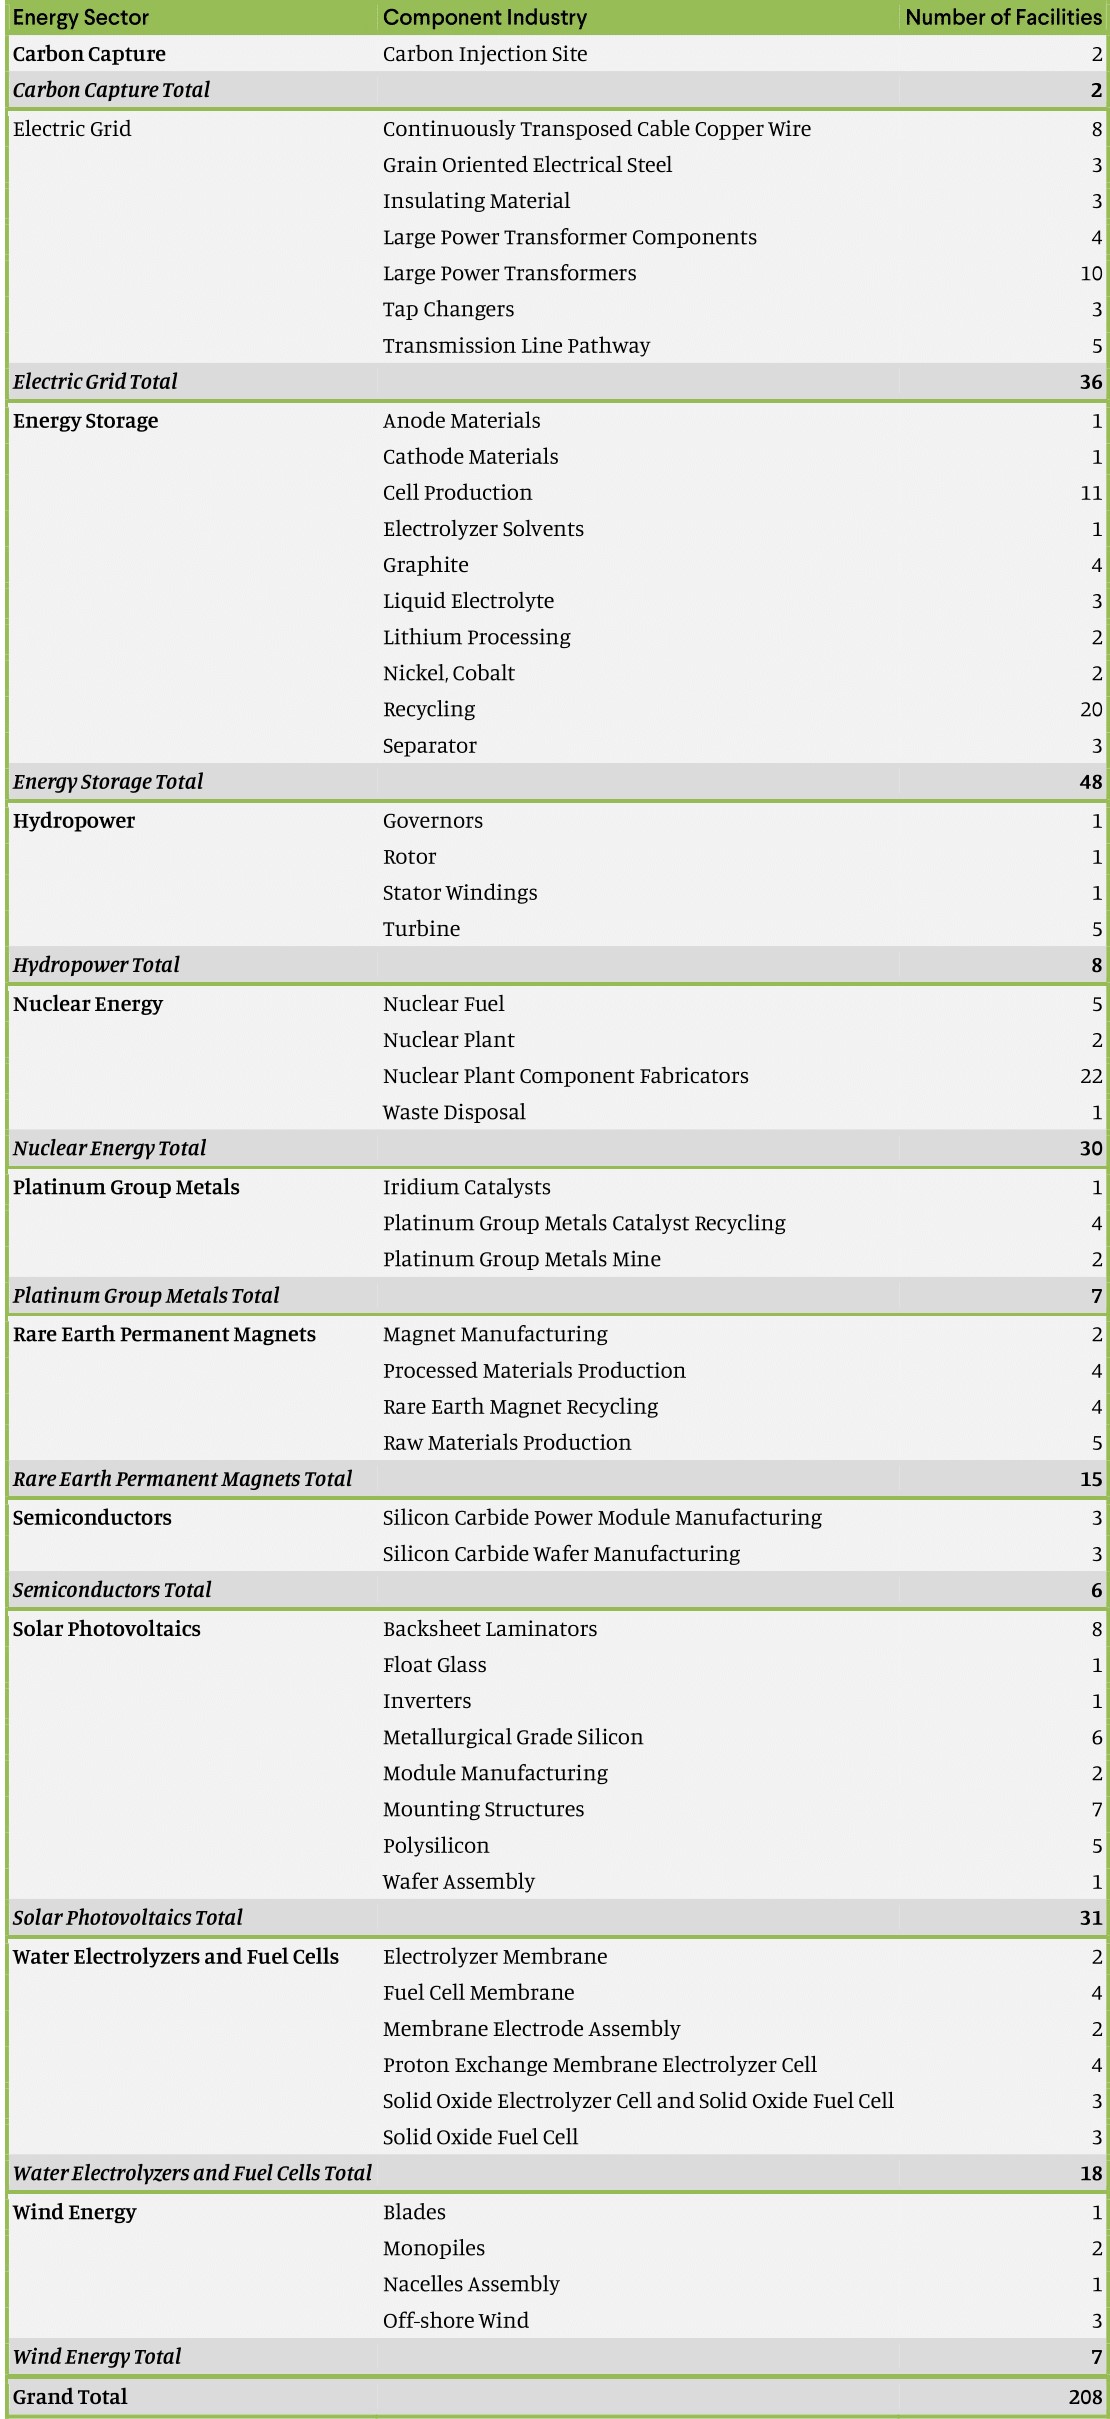
Source: Authors’ analysis of Department of Energy supply chain reports.
Methodology:
We read through the 11 supply chain reports published by the Department of Energy in 2022, looking for mention of specific domestic manufacturers, suppliers, or contractors that provide component inputs to domestic green energy sources. We specifically looked for discussions in which enough information on company name, component being manufactured, and/or facility location was provided to be able to identify a facility at the zip code level, using separate web searches. Locations were recorded when the company and state were explicitly mentioned or could be easily ascertained.
For cases where the zip code had multiple congressional districts, we used the facility address to find the corresponding congressional district. In 12 cases where a rough location was identifiable but an exact street address was not (as with offshore wind), we used a locational estimate. Where possible, we also distinguished between office locations/headquarters and manufacturing locations. Office spaces/headquarters, while critical to the supply chain, will not necessarily lead to the wide range of blue collar and white collar job and occupational opportunities that a manufacturing facility might.
Our conservative method means that there are likely many more supply chain opportunities than we have identified here. The 874 pages of supply chain reports cover 53 different subcomponent industries, and only a fraction of the text provides sufficient geographic context to identify specific facilities. In many cases, the sectoral reports contained high-level assessments of states and firms that stood to benefit from industry-specific investments, but did not contain sufficient geographic specificity for our mapping exercise. For example, the reports would state that manufacturing in a specific industry was concentrated in a state without going into detail about the name or location of specific companies. Furthermore, the subcomponents counted only represent a portion of all those mentioned in the supply chain reports. If the US does not currently have domestic capabilities for a subcomponent, it was not and could not be represented in our count, even though industrial policy may be able to produce capabilities in the future.
With more complete information on geographic locations of green energy supply chains, many more opportunities could be identified. This is a promising direction for future research, as is identifying communities that do not currently produce green energy products but would like to if given the necessary investments and policy support.
*Very special thanks to Ivan Cazarin, Keesa McKoy, and Michelle Wilczynski for research and technical assistance.
Authors