How Topline Economic Indicators—like Low Unemployment—Miss Struggling Communities
January 16, 2024
By Ira Regmi
Current macroeconomic indicators and labor market statistics paint a picture of a resilient economy underpinned by a robust labor market. The United States has enjoyed historically low unemployment rates, bottoming out at a mere 3.4 percent in January and April 2023. Unemployment remained relatively low throughout 2022 and 2023 despite a gradual upward trend, standing at a still-respectable 3.7 percent in December. When one turns attention to the state level, however, it becomes clear that the labor market is fragmented. Some of the nation’s most populated states are reaping minimal or no benefits from the tightness of the national labor market. Instead, these populous states, such as New York, New Jersey, Illinois, California, and Nevada, are contending with escalating unemployment rates that surpass pre-pandemic levels.
Furthermore, a worrying trend we’re witnessing is the increasing divergence of Black and Hispanic unemployment rates from both the overall and white unemployment rates in numerous states. These disparities across states and racial groups, as well as industries, illuminate the limitations of the current macroeconomic interventions being implemented at the federal level—monetary and fiscal. This points to a pressing need for alternative strategies tailored to the needs of the people and regions left behind in the wake of this economic recovery.
The precise causes of these variations in the reach of economic recovery and the degree to which they contribute are best understood as a confluence of many factors. These include demographic composition (age, gender, and race), industry concentration, degree of public investments, rural-urban differences, and migration patterns. After all, most individual states in the US are geographically larger than average-sized nations, making it harder for aggregate statistics to provide a representative picture.
A recent brief by Roosevelt Institute fellow Hiba Hafiz, “A Federal Job Guarantee to Combat Geographic Inequality,” demonstrates how rural and distressed urban communities face rigged labor markets. Hafiz highlights how place-based inequities and the state of labor markets in these areas are riddled with issues of monopsony or oligopsony, in which one employer or a small group of employers dominates the market. Additionally, the lack of regulatory interventions protecting workers and other regulatory lapses that have encouraged corporate consolidation have weakened workers’ bargaining power in some areas over others. In this regard, the varying pace of recovery across the US stems from the degree to which direct and targeted welfare and pro-labor interventions were prioritized, especially since, as Hafiz points out, the effects of monetary tightening are disproportionately felt by distressed and rural communities.
Recovery Is Geographically Disparate, with a Few States Paying the Price
While the federal stimulus during the pandemic led to a hot labor market in many areas, numerous states, including Nevada, Illinois, California, New Jersey, and New York, have been notably left out. The average unemployment rate was higher in 15 states in 2023 than in 2019, according to the Local Area Unemployment Statistics (LAUS) (figure 1). Over the same period, the average unemployment level increased in 18 states, and employment levels dropped in 19 states. Illinois, California, and New York, among others, are seeing both trends.
Figure 1
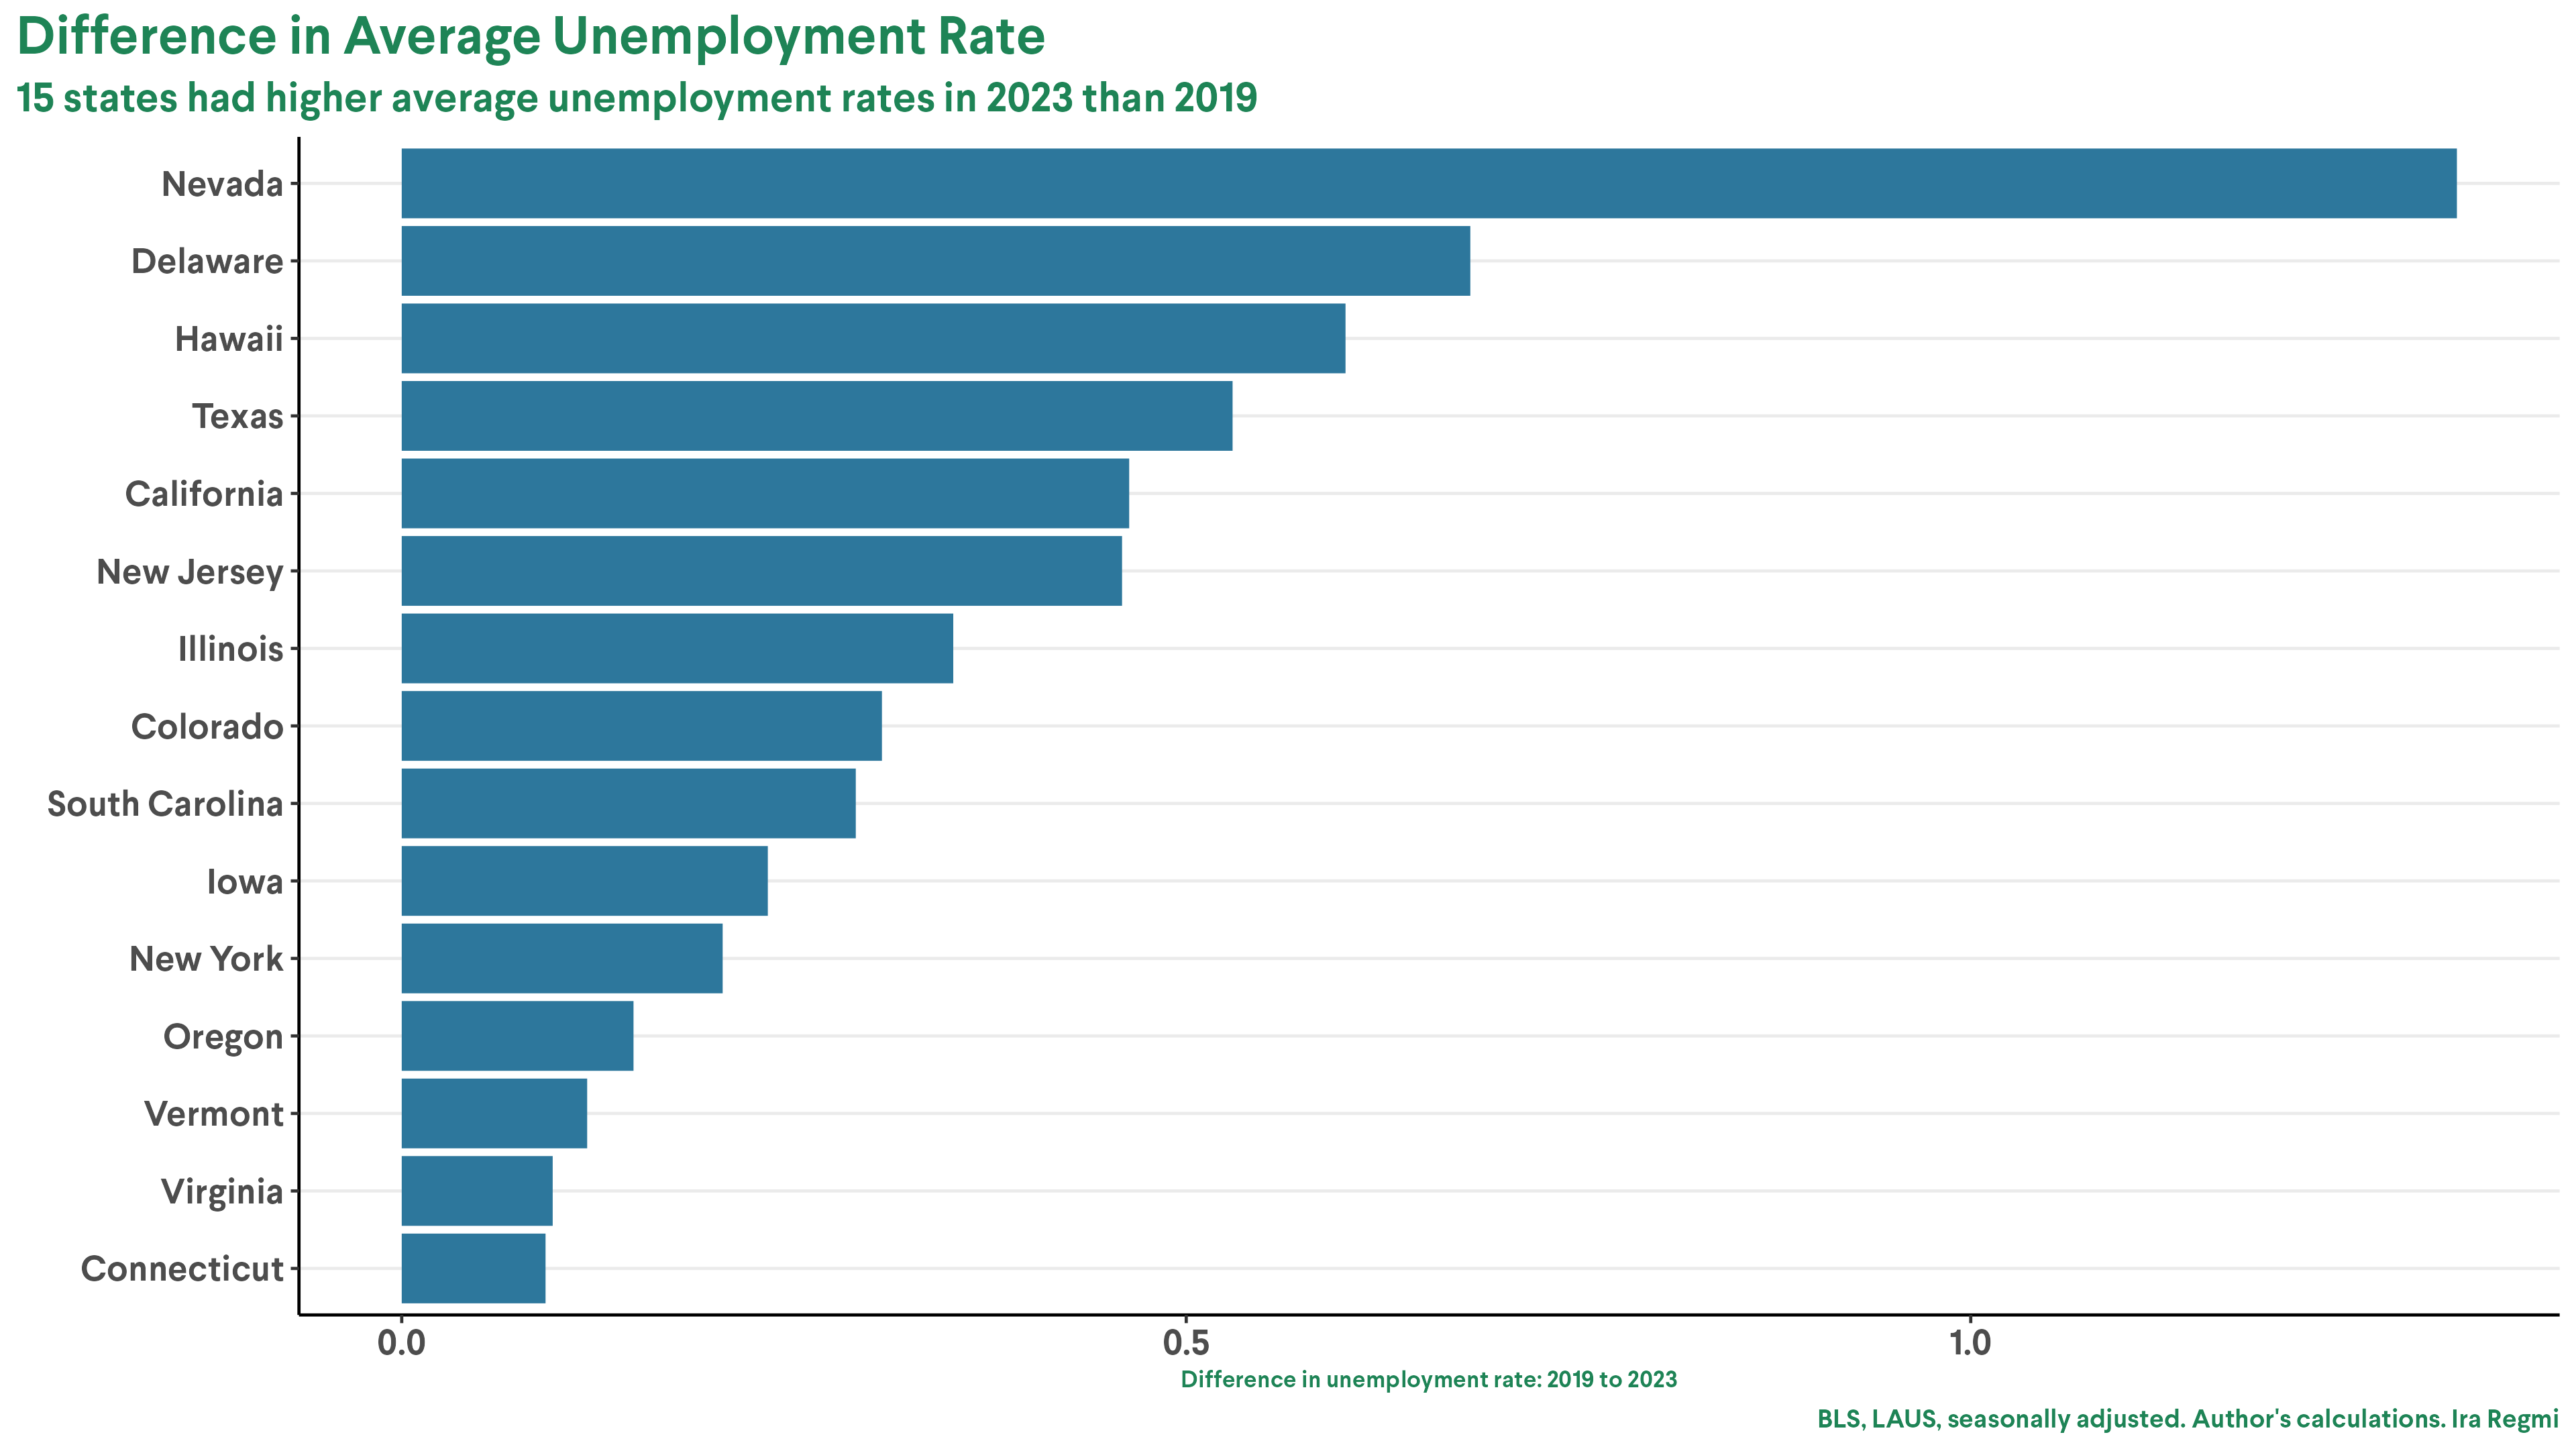
These elevated unemployment rates in most states cannot be dismissed as statistical anomalies. Rather, they are outcomes of complex economic patterns characterized by a rise in the number of unemployed individuals and reduced employment-to-population ratios and labor force participation rates. Of the 15 states that saw higher rates of unemployment, only four (New York, New Jersey, Oregon, and Virginia) saw an increase in employment-to-population ratios (figure 2), and only five (Texas, New York, New Jersey, Oregon, and Virginia) saw an increase in labor force participation rates. A total of 39 states have lower employment-population ratios in 2023, including states such as Illinois, Hawaii, and California. This suggests that these states are grappling with economic challenges impacting their labor markets and causing a shift in their employment landscapes.
Figure 2
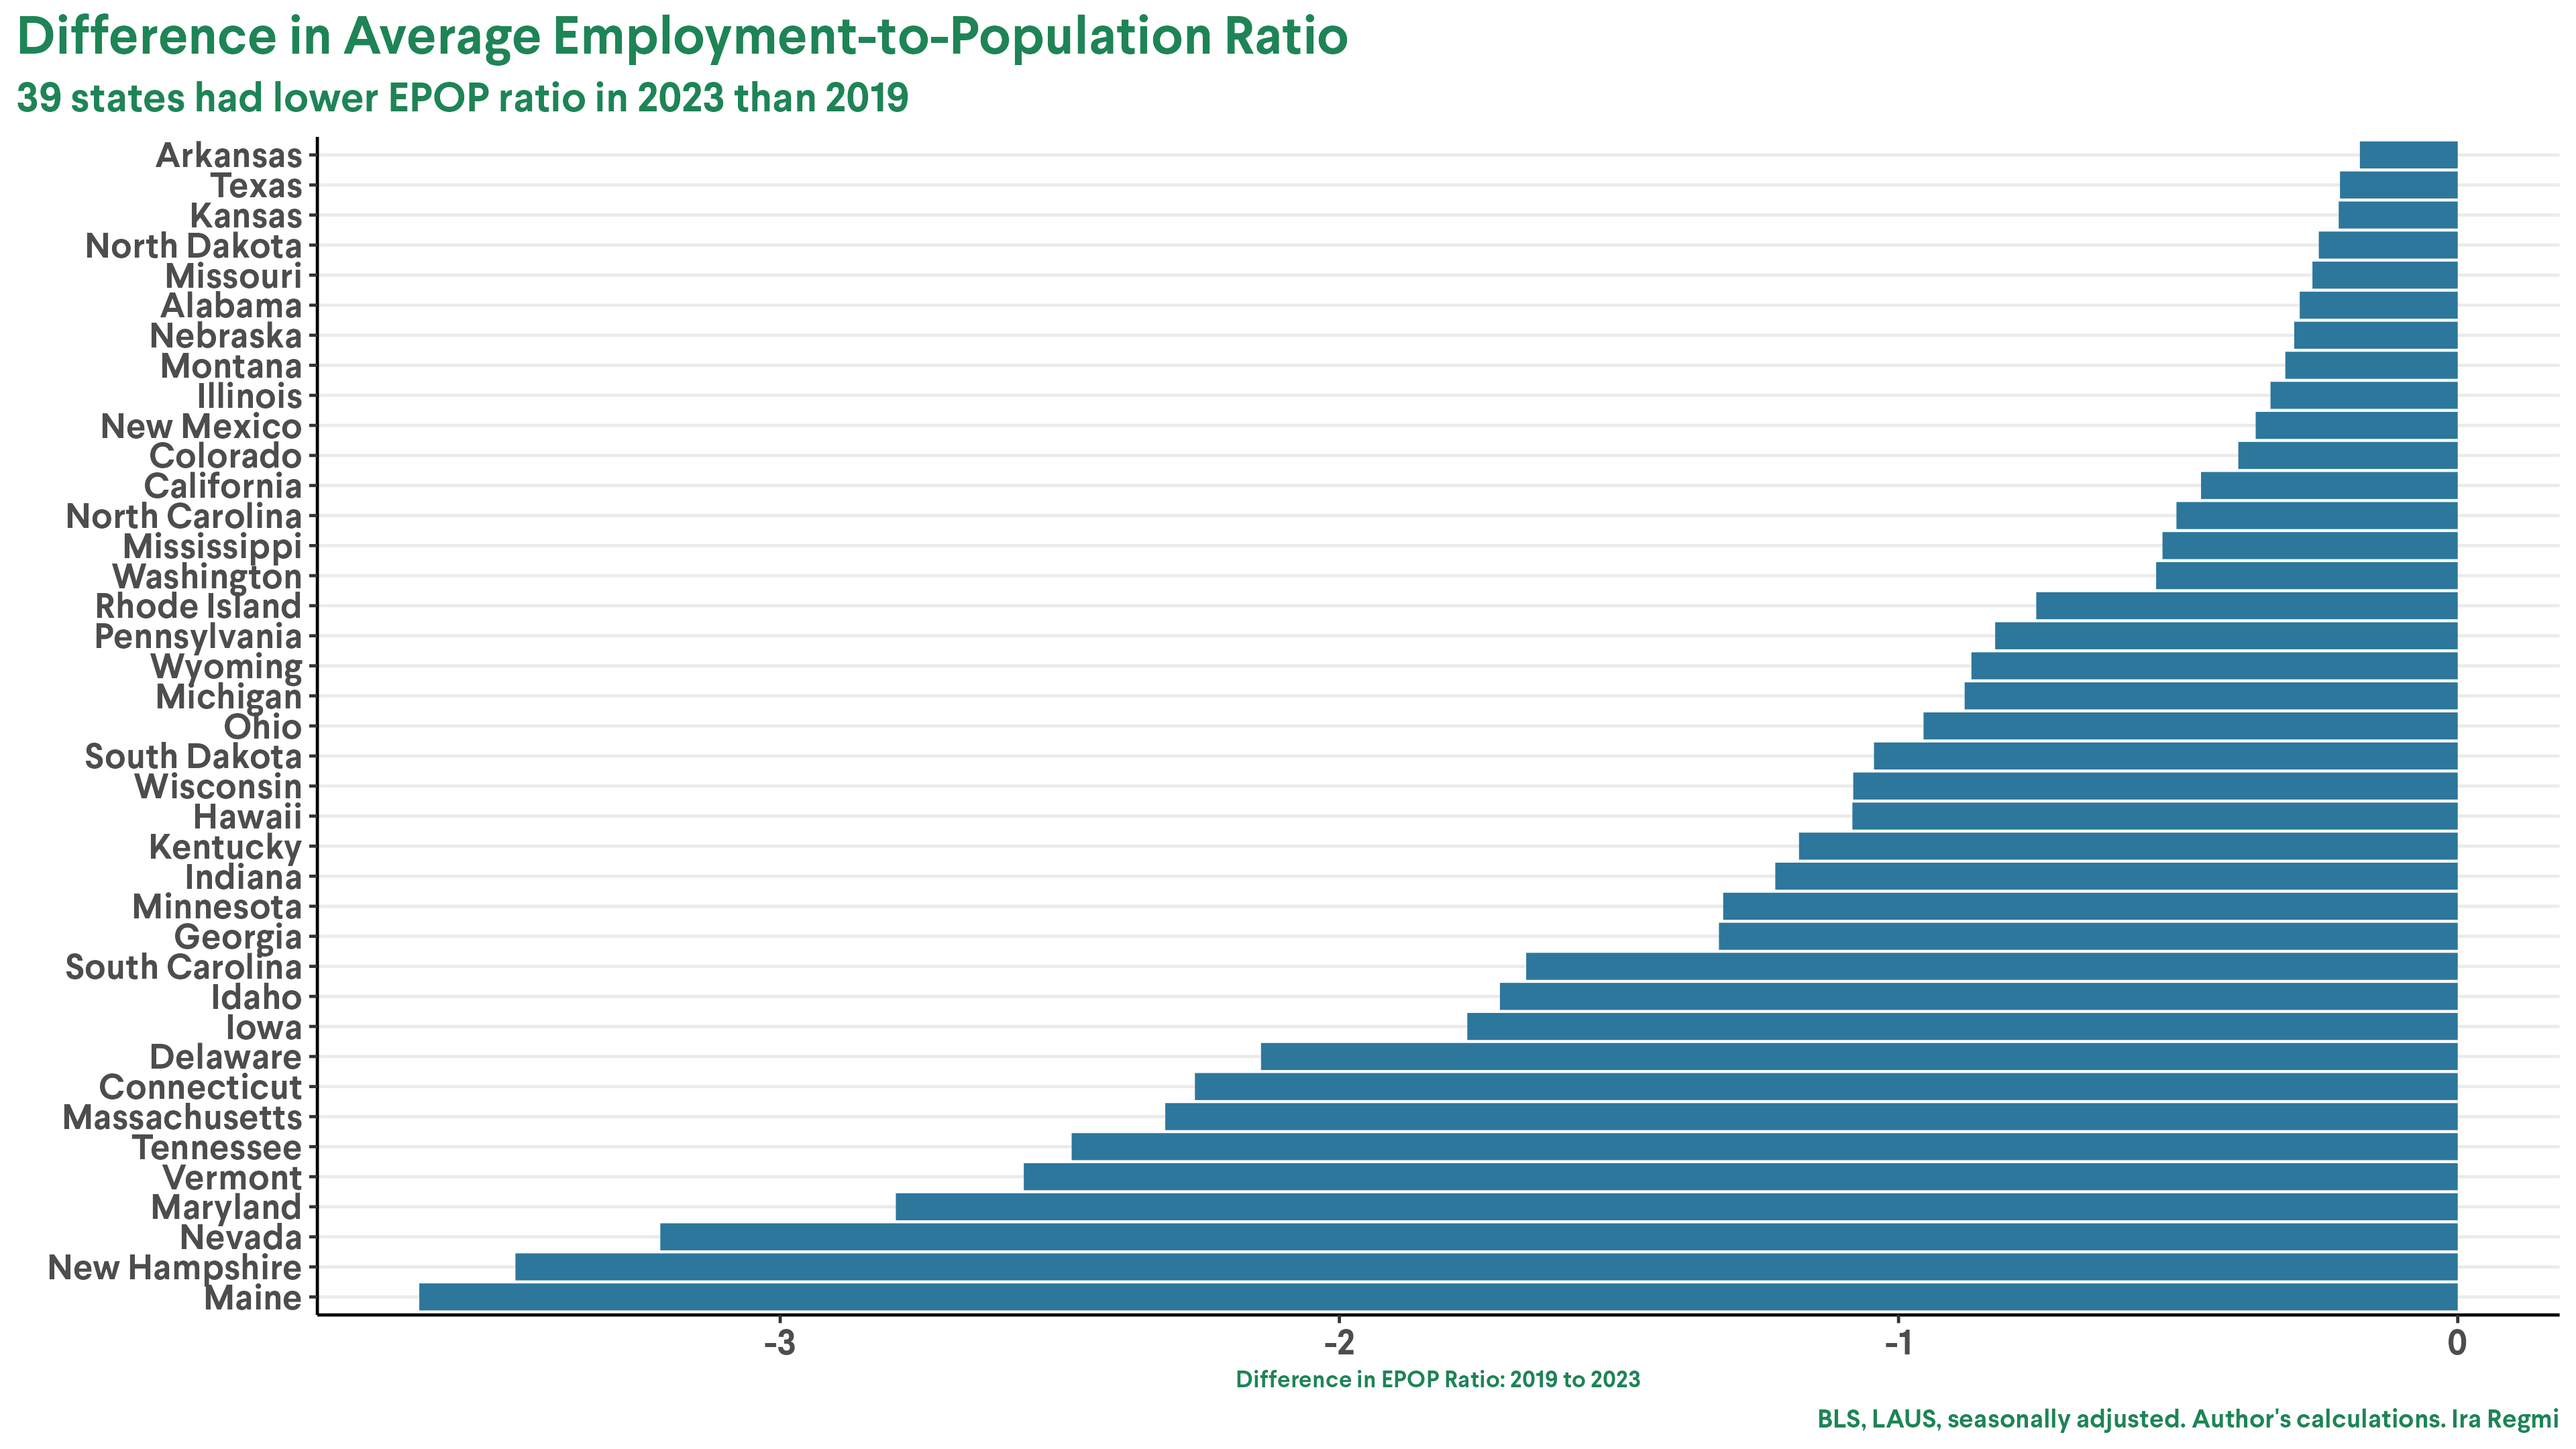
States with high unemployment rates, such as Texas, New Jersey, Delaware, Colorado, South Carolina, Oregon, Nevada, and Virginia, are experiencing growth in their labor forces. This growth corresponds to an increase in both employment and unemployment levels. Texas has seen the most significant expansion in labor force and employment numbers since before the pandemic but also the most significant rise in unemployment. Other states, like Hawaii, Illinois, Iowa, New York, Vermont, California, and Connecticut, are witnessing rising unemployment rates and decreasing employment numbers and labor force size.
At the local level, seasonally unadjusted data from the Bureau of Labor Statistics suggests that around 31.5 percent of Micropolitan Statistical Areas and 37.6 percent of Metropolitan Statistical Areas (MSAs) experienced higher average unemployment rates in 2023 than in 2019. The El Centro Metropolitan Statistical Area in California saw the country’s highest unemployment rate at 17.2 percent in 2023, down from 20.6 percent in 2019. The Kahului-Wailuku-Lahaina metropolitan area in Hawaii is the farthest away from recovery, with a 1.8 percentage point increase in unemployment between 2019 and 2023. Other MSAs also stand out, including San Francisco and San Jose in California, Kankakee and Danville in Illinois, Las Vegas in Nevada, and other areas in Michigan and New York, all of which suffered from higher unemployment rates toward the end of 2023 than in 2019.
Many states with these notable trends of increasing unemployment are home to densely populated urban areas. Over the past few decades, these metropolitan areas have seen significant increases in poverty rates. Although median income is higher in cities, according to the US Census the number of people living below the poverty line in MSAs has been higher than those living outside MSAs. These dense areas typically have a high concentration of jobs in leisure, hospitality, personal services, and retail—sectors which generally have higher unemployment rates and were particularly affected by the COVID-19 pandemic. According to LAUS, New York state’s average unemployment rate was 4.1 percent in 2023, compared to 3.9 percent in 2019. Puerto Rico and Nevada’s average unemployment rate topped the list at 6.1 percent and 5.4 percent respectively in 2023. Nevada, especially Las Vegas, was severely impacted by the COVID-19 pandemic, with an unspecified peak unemployment rate in 2020.
The Racial Unemployment Gap Is Widening in Certain States
A total of 20 states saw an increase in the unemployment gap between Black and white workers from Q2 of 2019 to Q2 of 2023 (figure 3). These include states with some of the largest populations of Black Americans in the US, such as California, North Carolina, South Carolina, and New Jersey. At the national level, data also indicate that unemployment rates are rising faster in Black and Hispanic communities.
Figure 3
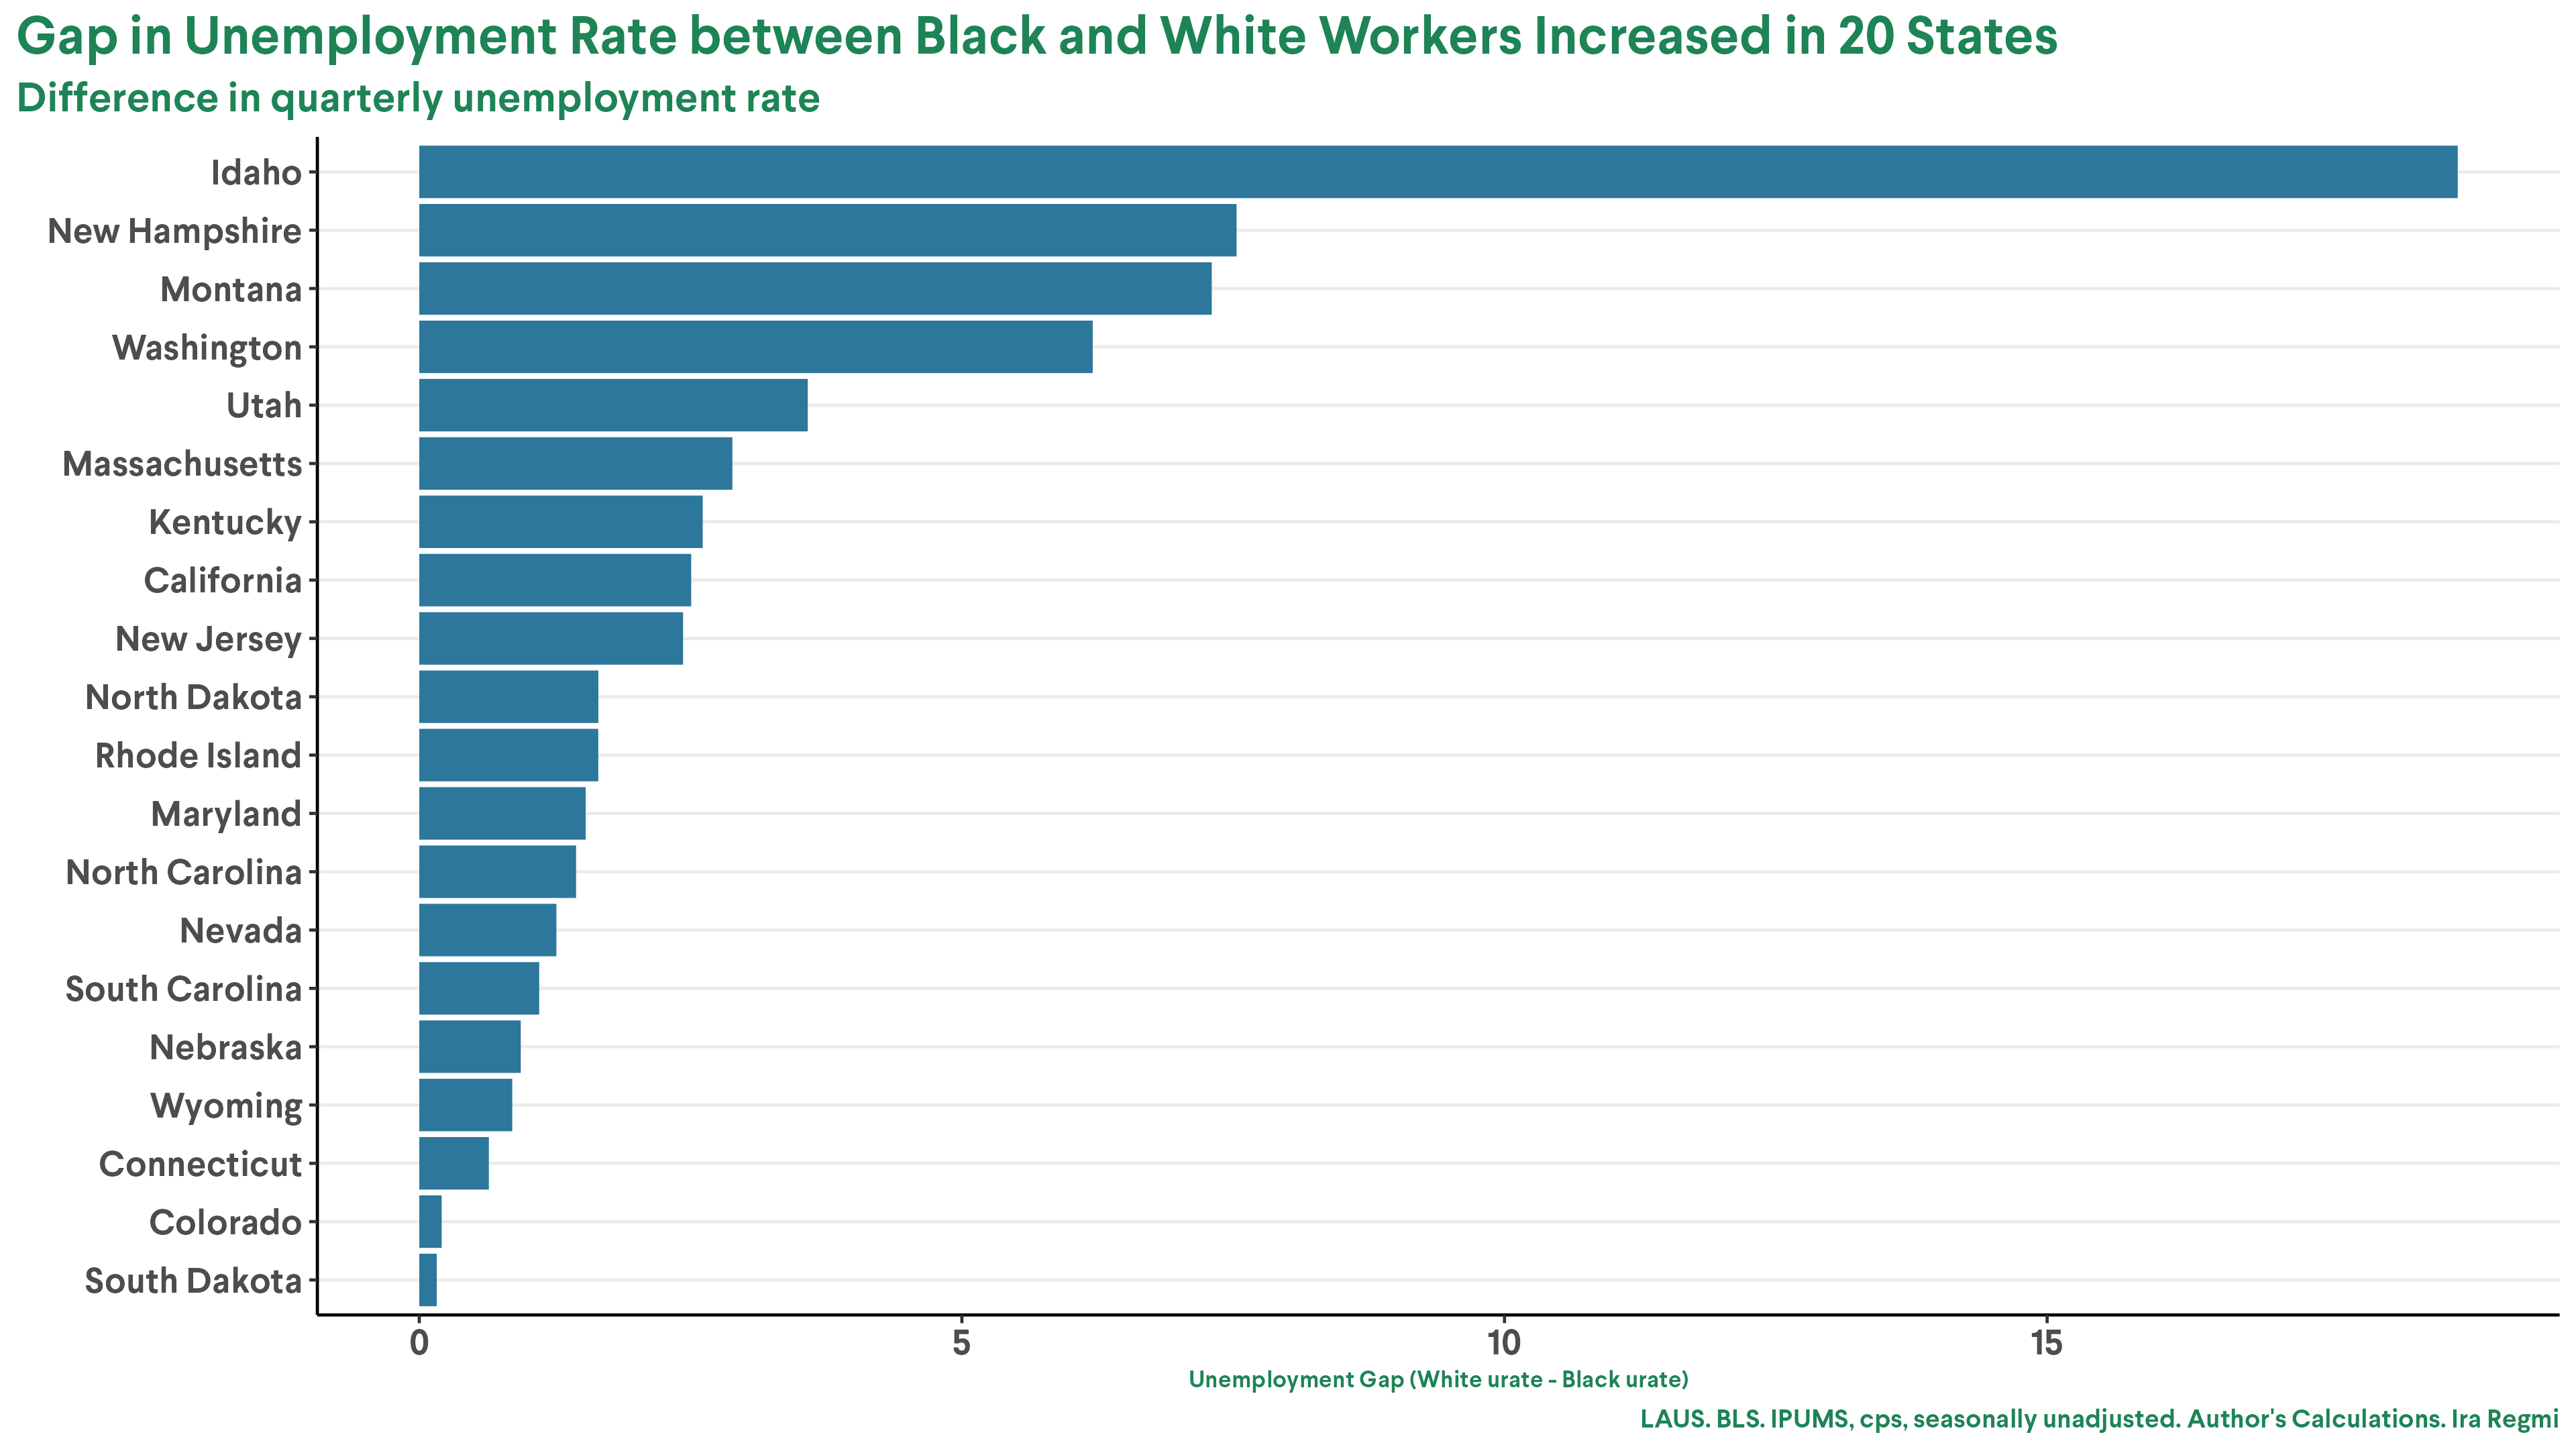
The unemployment rates calculated in this graph were obtained by replicating the process on quarterly data outlined by the Economic Policy Institute.
Montana, Illinois, Iowa, Utah, and Washington, DC, had the highest gaps in unemployment rates between Black and white persons for Q3 of 2023. The Black unemployment rate for Q3 of 2023 was 10.3 percent in Washington, DC, 12.2 percent in Montana, and 9.2 percent in Illinois. In Texas, New York, California, and Nevada, the unemployment rate for Black Americans in Q3 of 2023 was 6.8 percent, 6.4 percent, 7.4 percent, and 5.6 percent, respectively. Among the MSAs with a Black population above 15 percent, unemployment levels have risen in 32 percent of these areas compared to the pre-pandemic period. This trend is evident in 23 of the 72 MSAs, including major cities like Chicago, New York, Dallas, Las Vegas, San Antonio, and Austin. It also applies to the Charleston-North Charleston and Greenville-Anderson-Mauldin MSAs in South Carolina, a state that otherwise is experiencing lower unemployment rates than national averages (3.1 percent in 2023).
The counties experiencing high unemployment rates include significant counties across various states. In New York, this encompasses Brooklyn (Kings County), Bronx, and Queens counties. Both Washoe and Clark counties in Nevada and Cook, Adams, and Winnebago counties in Illinois also experienced this trend. These counties represent a large portion of the Black population in the US, with about 39 percent of Black Americans living in counties where 2023 unemployment rates surpassed those in 2019.
National unemployment data further support the increasing unemployment rate among Black Americans, which has stayed above 5 percent, only dipping to 4.3 percent in April 2023. While the average unemployment rate for Black Americans was 5.5 percent in 2023, lower than the 6 percent average for 2019, the average unemployment rate increased from 5.4 percent in Q1 of 2023 to 5.6 percent in Q4 of 2023. The average unemployment rate for Black Americans was also 2.3 percentage points higher than the average unemployment rate for white Americans (3.2 percent).
Targeted Interventions Can Help Struggling Communities
To ensure a balanced economic recovery, it’s crucial to implement policies targeting struggling regions and communities. Both federal and state-level actions are necessary to address labor market disparities. Strengthening protections against child labor and immigrant exploitation, increasing funding for labor standard enforcement, and upholding workers’ rights to organize are all effective federal measures. Likewise, approaches such as a federal job guarantee, which places the responsibility of employment on the government rather than on marginalized and disenfranchised individuals, are equally important. In the earlier brief about place-based inequities, Roosevelt fellow Hiba Hafiz suggests that implementing a federal job guarantee program costing only a third of the Biden administration’s infrastructure spending to date—an estimated $1.09 trillion—could employ 23.4 million people.
This recovery has undoubtedly been more robust than the last. However, data corroborates what polls have indicated—despite a strong overall recovery, certain groups are still being left behind, evidenced by significant racial and regional gaps. The American Rescue Plan and similar direct support initiatives were vital during the COVID-19 pandemic, as they offered essential assistance to households and businesses amid an unprecedented crisis. These macroeconomic interventions involved significant fiscal expansions and helped foster rising worker power. However, they did not address sector-specific issues, demographic challenges, or systemic issues rooted in institutional indifference toward the racist underpinnings of our society. While policy interventions viewed through an anti-austerity lens—as well as the subsequent increase in direct fiscal support or tax credits—are beneficial and likely to favor marginalized communities disproportionately, this disproportionality underscores not the racial equity advantages of these policies, but rather the extent of marginalization faced by Black and brown communities.
While the indirect benefits to communities of color are welcomed, they are neither sufficient nor reflective of a race-conscious approach to these policies. The takeaway is that while broad initiatives are critical, they cannot replace targeted interventions to support struggling sectors, communities, and regions.
Author