How to Reduce Poverty Among SSI Recipients: Modeling the Impact of the SSI Restoration Act
February 5, 2026
By Stephen Nuñez
Over the last year my colleague Jack Landry and I have been working to quantify the impacts and costs of a family of policy proposals meant to reform the Supplemental Security Income (SSI) program, a cash benefit administered by the Social Security Administration that provides vital aid to more than 7 million adults and children with disabilities and older adults with little to no income or assets.
At its inception in 1974, SSI represented a major advance from the patchwork of state disability benefits that preceded it, creating a financial baseline that states could build upon to serve their residents. Since then, however, state aid has largely withered away, and SSI has not evolved to meet the financial needs of its recipients. As a result, 50 years after its launch, most SSI recipients live at or below the federal poverty line.
Lawmakers have, in recent years, introduced a small number of bills meant to address this. These include the bipartisan SSI Savings Penalty Elimination Act and the SSI Restoration Acts of 2021 and 2024. We have focused our work on the SSI Restoration Act of 2024 both because it includes major changes to the SSI means-testing formula and to maximum benefits and because there is limited research on the effects these changes might have on SSI recipients.
This blog previews our upcoming report. Below I describe the legislative provisions we examined and our methodological approach before sharing some key findings.
Major Features of the SSI Restoration Act of 2024
The SSI Restoration Act of 2024 includes changes to SSI’s asset limits, means-testing formula, and maximum benefit amounts and indexes these changes to inflation using the Consumer Price Index for Elderly Consumers (CPI–E). The changes to asset limits are identical to those included in the SSI Savings Penalty Elimination Act, which I have written about previously. Our analysis focused on the following included changes to means-testing and benefits calculations:
- updates the unearned/general income exclusion from $20 per month to $150 per month
- updates the earned income inclusion from $65 per month to $487 per month
- removes “in-kind support and maintenance” from income calculations (see below)
- sets the maximum benefit for a single recipient to the Federal Poverty Line for a household of one
- sets the maximum benefit for a married couple both receiving SSI benefits to double that value
Approach
To compute the impacts on poverty and the cost of these changes individually and collectively, we use a methodology called microsimulation. We use survey data that includes detailed information about people’s income, benefits, and household composition from the Census Bureau’s Current Population Survey’s Annual Social and Economic Supplement for 2024. We then simulate what individuals’ SSI benefits are and would be under current and proposed program rules. After calculating total household income (inclusive of SSI benefits), we compare it to the Supplemental Poverty Measure (SPM) poverty line threshold to determine whether a household is poor. Aggregating this process over thousands of survey responses allows us to calculate and compare status quo poverty rates to those under the SSI Restoration Act.
Findings
Our model estimates impacts relative to our policy baseline. Table 11 presents our estimate of poverty and deep poverty (defined as at or below 50 percent of the SPM poverty line) among US households in general and households with an SSI recipient specifically. We estimate that in 2024, of the roughly 130 million households in the United States, 13.33 percent (17.38 million) lived in poverty and 4.81 percent (6.27 million) lived in deep poverty. We estimate that 6.16 million households contain one or more SSI recipients (7.25 million recipients in total), that 29.21 percent of them (1.8 million) fall below the SPM poverty line, and that 4.41 percent of them (270,000) fall below the deep poverty threshold.
Table 2 presents our estimates of poverty and deep poverty among US households in general and SSI households specifically if the SSI Restoration Act of 2024 went into effect.
Figure 1
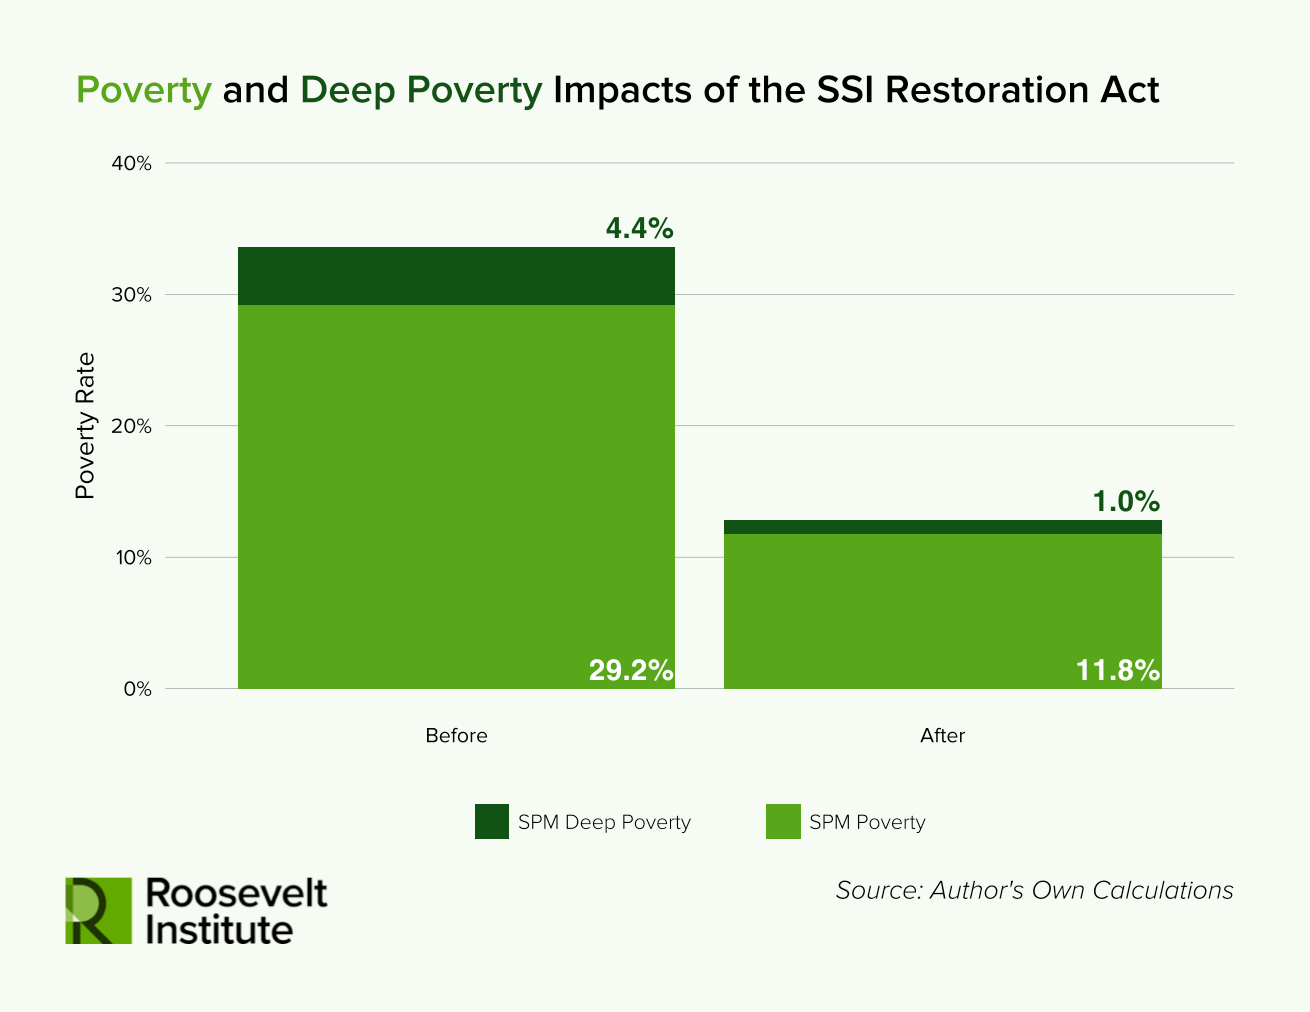
We estimate that the SSI Restoration Act would generate an additional 2.58 million SSI recipient households (an additional 2.8 million new SSI recipients in total).These are households that include one or more disabled individuals but that have income too high to qualify for SSI under current rules. The SSI household poverty rate would drop by 17.46 percentage points to 11.76 percent. Deep poverty in SSI households would drop by 3.42 percentage points to 0.99 percent. Overall household poverty would drop by 0.89 percentage points to 12.44 percent. And overall deep poverty would drop by 0.18 percentage points to 4.63 percent.
We are also interested in the impact of the individual components of the SSI Restoration Act. For example, what would the impact on poverty be if the maximum benefit was increased but no other changes were made? Table 3 presents our analysis of the impacts of implementing certain provisions of the SSI Restoration Act in isolation.
Figure 2
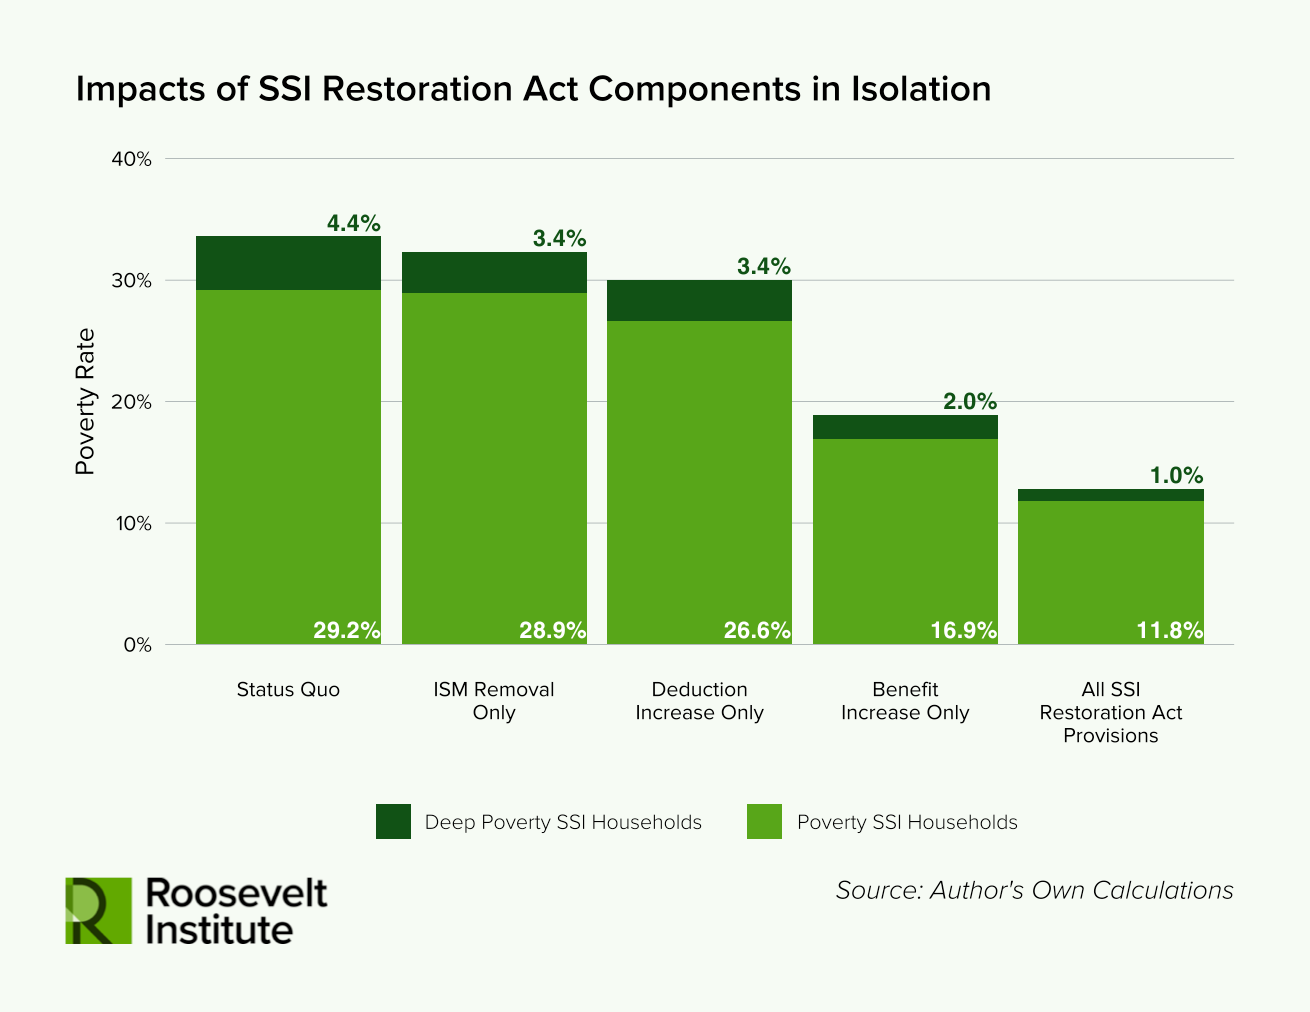
We find we could derive an impact roughly 71 percent as large from increasing the maximum monthly benefit alone. Simply increasing the maximum monthly benefit to match the Federal Poverty Line for a household of one (and doubling it for married couples) would reduce the SSI household SPMpoverty rate to 16.87 percent. Conversely, changes to the earned and unearned income exclusions alone would only reduce SSI household poverty to 26.56 percent. And removing the in-kind support and maintenance (ISM) component of the benefit means-test—a measure of food or shelter provided to an SSI recipient by someone else—alone would only reduce SSI household poverty to 28.91 percent. These provisions are less impactful for several reasons we discuss in the upcoming paper. The ISM component of the benefit means-test, for example, currently only affects about 9 percent of SSI households, so removing it does not affect the vast majority of recipients.
We also looked at impacts by region and on a variety of different subgroups, including married couples, children, and elderly recipients. Table 4 includes, as an example, our estimates of impacts on individual poverty rates for SSI recipients by racial and ethnic group.
Figure 3
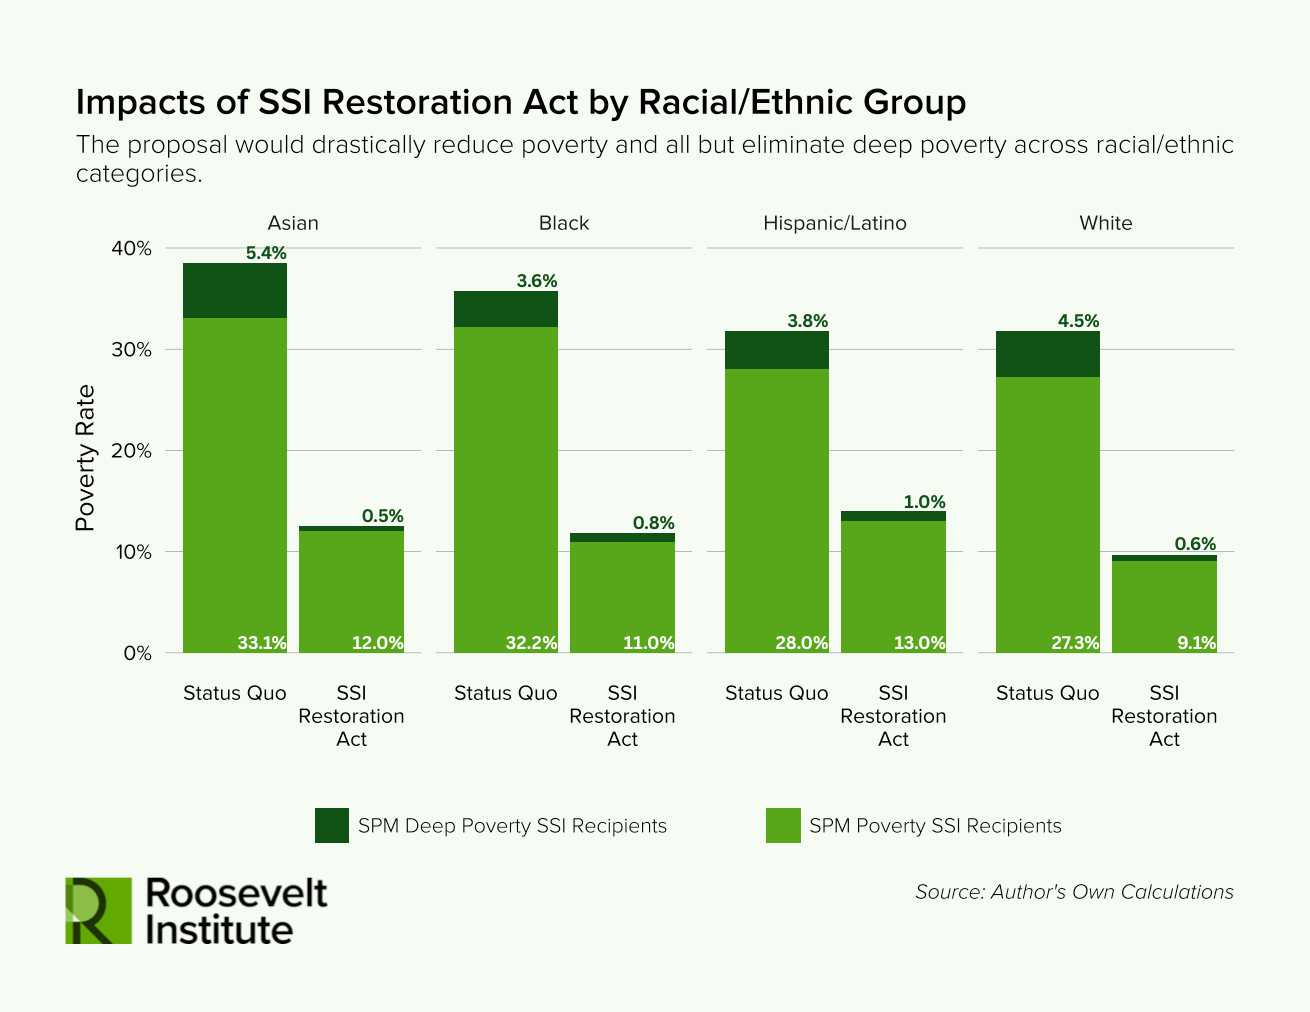
Some of the variation in the impact of the SSI Restoration Act on SSI recipients by race/ethnic group derives from differences in household composition and income source, but the overall story is the same: A poverty rate of around 30 percent is reduced to a poverty rate roughly equivalent to that of the general population.
Cost
The SSI Restoration Act has large impacts on recipient poverty and deep poverty, almost entirely eliminating the latter. But how much would it cost to implement this policy? We investigated both the overall cost of the program and the cost of implementing various components in isolation. This information in conjunction with the impact estimates presented above may be helpful to legislators as they consider financing options and mechanisms to prioritize. Table 5 presents overall cost estimates and cost by individual component.
We find that the SSI Restoration Act of 2024 would cost about $61 billion annually in real 2024 dollars. This is roughly in line with the Social Security Administration’s estimate that the earlier SSI Restoration Act of 2021 would cost an average of $51 billion per year in real 2020 dollars, given inflation over the intervening period. We find that the most expensive single component of the SSI Restoration Act is the increase in maximum benefit. According to our (preliminary, subject to change) estimates, implementing a benefits increase alone as structured in the bill would cost roughly $33.8 billion per year in real 2024 dollars. Only altering the earned and unearned income disregards would cost roughly $8.5 billion per year, and only removing the in-kind support and maintenance provision from the SSI benefits calculation would cost roughly $3.3 billion.
Conclusion
Overall, the SSI Restoration Act would bring SSI household and individual poverty rates largely in line with overall poverty rates. In fact, accounting for new beneficiaries, we find that SSI household and poverty rates would be slightly lower than the overall averages. Under the status quo, SSI household and individual deep poverty rates are already broadly similar to overall averages, reflecting a success of the program. Under the SSI Restoration Act, deep poverty among SSI recipients and members would be almost entirely eliminated: Less than 1 percent of households and only about three-quarters of a percent of recipients would live in deep poverty.
It does this at an additional cost of roughly $61 billion per year, which is similar to what SSI currently costs ($64–65 billion per year), meaning that the SSI Restoration Act would almost double annual expenditures on SSI. However, most of its impact comes from its proposed benefit increase, which would cost around $34 billion per year to implement.
We will have much more to share on SSI—including a description of its history, the components of the program the SSI Restoration Act does not touch, other potential avenues to reform, and the high costs of living with a disability—in the full report, which will be released soon. Stay tuned.
Footnote
- All numbers in this and subsequent tables are rounded to the nearest ten thousand. Percentages are based on these rounded numbers. ↩︎
Author