The Other Big Jobs Revision That Matters This Year
February 27, 2026
By Michael Madowitz
There’s a less-famous data revision coming our way, but this year it might be more important. Next week, the household survey numbers for 2026 will be adjusted to reflect the change in US population. This will provide insight for economists and policymakers about the makeup of the labor market and what kind of impact the administration’s deportation regime has had on the economy.
Jobs reports come from two surveys that undergo significant baseline revisions each year, the Household Survey and the Establishment Survey. Essentially, the surveys work like polls: The Bureau of Labor Statistics surveys lots of people (and companies, but we covered the establishment survey revisions last month), then weights responses to match characteristics of the population. (I’m slightly oversimplifying this 175-page technical manual, which is a thing of beauty.) This year, it’s not a niche academic exercise; it will give us our first clear reflection of the fairly unprecedented decline in net migration in official household jobs numbers.
The baseline revisions to firm surveys occur in February and receive more attention—especially from People on the Internet—because the update procedure revises existing data from the previous year. The official number of jobs gained in the previous year then goes up or down, often by large amounts. (For a deeper dive on this, we got you last month.)
The revisions to the household survey, which are informed by updated population controls (monthly subpopulation projections from a mix of refined estimates and observed data) from numerous federal agencies in collaboration with the Census Bureau, are usually academically interesting but overshadowed by establishment data revisions. Because these population controls are only updated on a forward-looking basis, they create their own weird effects. For example, over the last decade, population growth mostly stayed between roughly 120,000 and 220,000 per month. This excludes each January, when we switch to new population controls for the year ahead. The official population fell by 650,000 or more in three of the four Januaries pre-pandemic (Jan. 2017, 2019, and 2020), and in the last three years, January population adjustments have been 1.12 million, -450,000, and 3.05 million. This is not April blackouts causing a baby boom; it’s just that population controls only affect future population, employment, and labor force levels, so we get these jumps that appear strange.
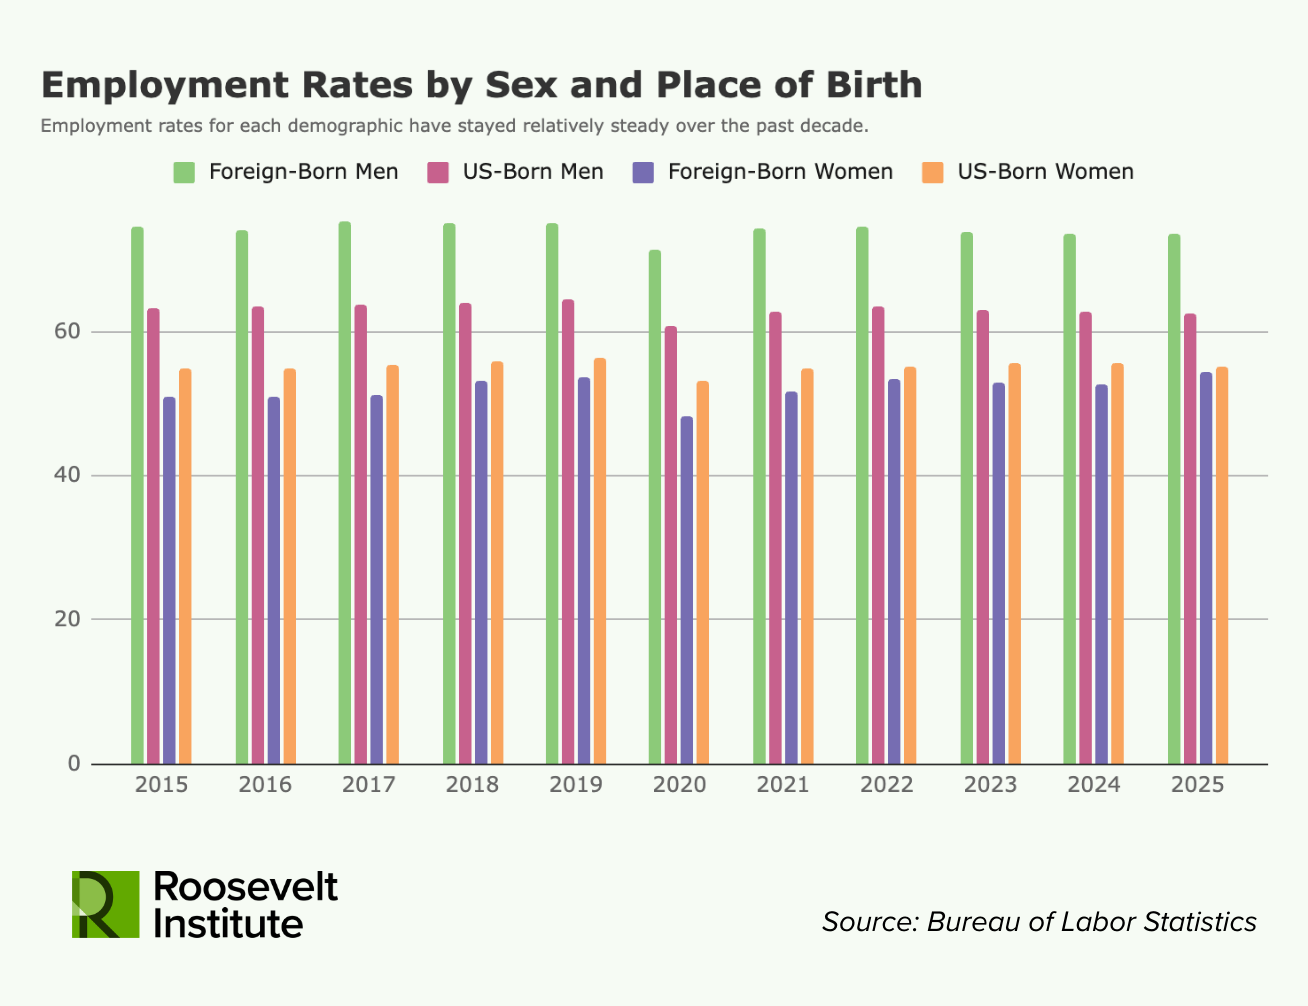
This year, the demographic breakdown of this adjustment is highly anticipated and somewhat dreaded by economists. It could have actual effects on economy-wide numbers due to the rapid collapse in net migration, stagnating population growth, and continued population aging. An older population is less likely to work (retirement is a good thing!), while foreign-born men have far and away the highest employment ratios across the economy. If population adjustments change those proportions significantly, that could change the picture of the entire labor market. As the graph below shows, employment rates for each demographic, broken down by gender and place of birth, tend to remain steady.
After a year of peering at tea leaves—and having to debunk flatly wrong viral claims about the employment effects of the collapse in net migration—it will be a relief to have more concrete numbers to go off. Even if what the numbers tell us may not be especially relieving about the state of the US economy.
Authors