What “Risk Aversion” Gets Wrong About the Racial Wealth Gap
September 11, 2025
By Zawadi Rucks-Ahidiana

Table of Contents
Introduction
In explaining the persistent gap in wealth holdings between Black, Latinx, and White Americans, scholars often reference risk aversion—the preference to avoid the possibility of losing money through investments. Also referred to by the opposing concept of risk tolerance or risk willingness1, risk aversion features commonly in research on the racial wealth gap because high-return investments like stocks also often involve higher risk and the potential for some loss. The underlying logic is that if Black and Latinx Americans are less willing to take on risk in investments than White Americans, then White Americans’ assets will continue to grow while Black and Latinx Americans’ assets will be stagnant (Choudhury 2001). While most scholars do not posit that changes in risk aversion among Black and Latinx Americans would close the enormous wealth gap, it seems to be a focal point of study within the racial wealth gap literature because it is theoretically changeable, as suggested by proponents of financial education. It also appears frequently in public discourse, in such headlines as “Investing Is Key to Closing Wealth Gap,” (Sweets 2025) “Minorities – Close the Wealth Gap Through Investment,” (Fontana 2021) and “Stocks Are Soaring, and Most Black People Are Missing Out” (Choe 2020).
Studies of risk aversion assume that risk tolerance is the “right” way to approach investment decisions. Sometimes this is indirect or implicit based on the reason that risk aversion is the topic of study (thus implying that aversion is a factor that may suppress wealth accumulation and is worthy of investigating), but when it is stated clearly and explicitly, risk aversion is positioned as the wrong choice. For example, commonly used financial literacy measures ask respondents whether stocks or mutual funds are the safer investment strategy. These studies deem the answer of “stocks” as correct (as they could result in higher returns) and thus an indicator of financial literacy, despite the difference in risk between stocks and mutual funds (Lusardi and Mitchell 2014; Remund 2010). This interpretation of risk aversion as “wrong” focuses on individual choice or attitudes and ignores the context in which people make decisions. Ultimately, it assumes that Black and Latinx Americans face the same conditions and circumstances as White Americans.
But “risk aversion” may not actually be what it seems. First, we don’t really know what we are capturing in measures of risk aversion. Survey questions used to measure risk aversion are subjective and could mean dramatically different things to respondents who say they are willing to take on the same amount of risk. Second, racial variation in risk aversion may not actually be capturing aversion to risk. Instead, it could be capturing rational decisions based on differences in financial position or socioeconomic status. In fact, this brief shows that socioeconomic variables explain 10 percent of risk aversion, while racial variables only explain 1 percent. If, as these findings suggest, differences in risk aversion are due to differences in socioeconomic status, being risk averse is the “right” choice because it is a rational decision for some respondents, such as those working low-wage jobs and those with low levels of wealth. Racial differences in socioeconomic position do not need individual interventions to correct “poor” decision-making. They need higher-level interventions to address discrimination, racism, and the intergenerational inequality that keep Black and Latinx Americans behind.
The Challenge of Measuring Risk Aversion
Risk aversion is generally captured with measures that ask survey respondents about what level of risk they are willing to take on. One example is the Survey of Consumer Finances (SCF) conducted by the Federal Reserve Board2, which asks respondents:
Which of the statements on this page comes closest to the amount of financial risk that you are willing to take when you save or make investments?
- Take substantial financial risks expecting to earn substantial returns
- Take above average financial risks, expecting to earn above average returns
- Take average financial risks expecting to earn average returns
- Not willing to take any financial risk
Based on their answer, respondents are categorized as risk averse if they are not willing to take on any financial risk and risk tolerant if they are willing to take on substantial or above-average levels of risk3. As this suggests, surveys used in the study of risk aversion actually capture four categories of respondents who vary in their willingness to take on risk rather than a binary of risk averse and risk tolerant, as the term may suggest.4
These categorial descriptors are not defined for survey respondents and are thus subject to interpretation.5 When a respondent answers “take average financial risks expecting to earn average returns,” we do not know what “average” means to them. Is average financial risk a 50 percent chance of loss? Is average returns a 25 percent return? These answers are likely to vary by respondent, as well as by a number of factors such as their monthly income, existing assets and debts, the amount they lend or borrow from friends and family, future expenses for children or retirement, and even what kind of investment they interpret to be “risky.” What these responses mean and what informs them is unclear.
The subjective nature of the measure of risk aversion described above surfaces in mixed evidence on whether risk aversion, when defined in this way, actually contributes to investing in risky assets. Shin and Hanna (2015) found that Black, Latinx, and Asian/other race respondents who reported willingness to take on substantial risk were not more likely to hold high-return assets like stocks than those who reported not being willing to take on any risk. Similarly, Gutter et al. found that “White households are more likely than Black households to exhibit consistent behavior—being willing (unwilling) to take risk and actually owning (not owning) risky assets” (1999). These findings suggest that risk tolerance or willingness is not always associated with investment behavior that would increase returns to investment, which could be due to risk aversion not measuring what we think it measures.
One potential solution is to use a different question to measure risk aversion, but those that have been used to date face similar problems. For example, some surveys ask respondents to rank their willingness to take on risk on a scale from 1 to 10, where 1 is low willingness to take on risk and 10 is high willingness. But this question also tells us little about what risk means to the respondents. We don’t know if risk is interpreted as losing 100 percent of a $10,000 investment, 50 percent of $5,000, or even 10 percent of $300.6
Importantly, all of the potential contributing factors to how respondents interpret “risk” also vary by race. Black and Latinx Americans make less than White Americans. They hold less in wealth than White Americans. And they are more likely to lend to family and friends than White Americans (Heflin and Pattillo 2006; Chiteji and Hamilton 2002). These racial differences may not only contribute to racial differences in the interpretation of survey questions, but may contribute to the racial differences in the results of risk aversion studies to date.
The Role of Class Position in Racial Differences in Risk Aversion
While we know that race and class are highly correlated in the US, not all studies of racial differences in risk aversion account for socioeconomic position.7 Studies find that higher education (Han et al. 2024; Gutter and Fontes 2006; Coleman 2003; Hanna, Wang, and Yuh 2010), higher income (Gutter and Fontes 2006; Hanna, Wang, and Yuh 2010), and higher net worth (Gutter and Fontes 2006; Coleman 2003) are all associated with lower risk aversion (as measured by being unwilling to take on any risk in most studies), but these studies do not necessarily account for Black and Latinx Americans’ lower socioeconomic position on all of these markers of social position in relation to White Americans. The studies that do control for wealth, income, or both find no differences in risk aversion between Black and White survey respondents (Gutter, Fox, and Montalto 1999; Anvari-Clark and Rose 2023; Gutter and Fontes 2006; Coleman 2003). To demonstrate the role of class position in risk aversion, I present descriptive analyses using data from the 2019 SCF based on the four-category risk willingness question described above.8 I looked at willingness to take on risk (substantial, above-average, average, or none) by race and net worth (Figure 1), income (Figure 2), and educational attainment (Figure 3).
Figure 1 shows the willingness to take on risk by race and the quintile of net worth holdings. Across all racial groups, willingness to take on no risk or average risk is higher for those in the first, second, and third quintiles of net worth. Similarly, willingness to take on average risk is the most common response for those in the fourth quintile of net worth across racial groups. However, within the fourth quintile of net worth, Latinx respondents had similar rates of willingness to take on average, above-average, and no risk, including the highest rate of willingness to take on no risk. In contrast, Black respondents with fourth-quintile net worth had the highest rate of willingness to take on average and substantial risk and the lowest willingness to take on above-average and no risk.
Figure 1
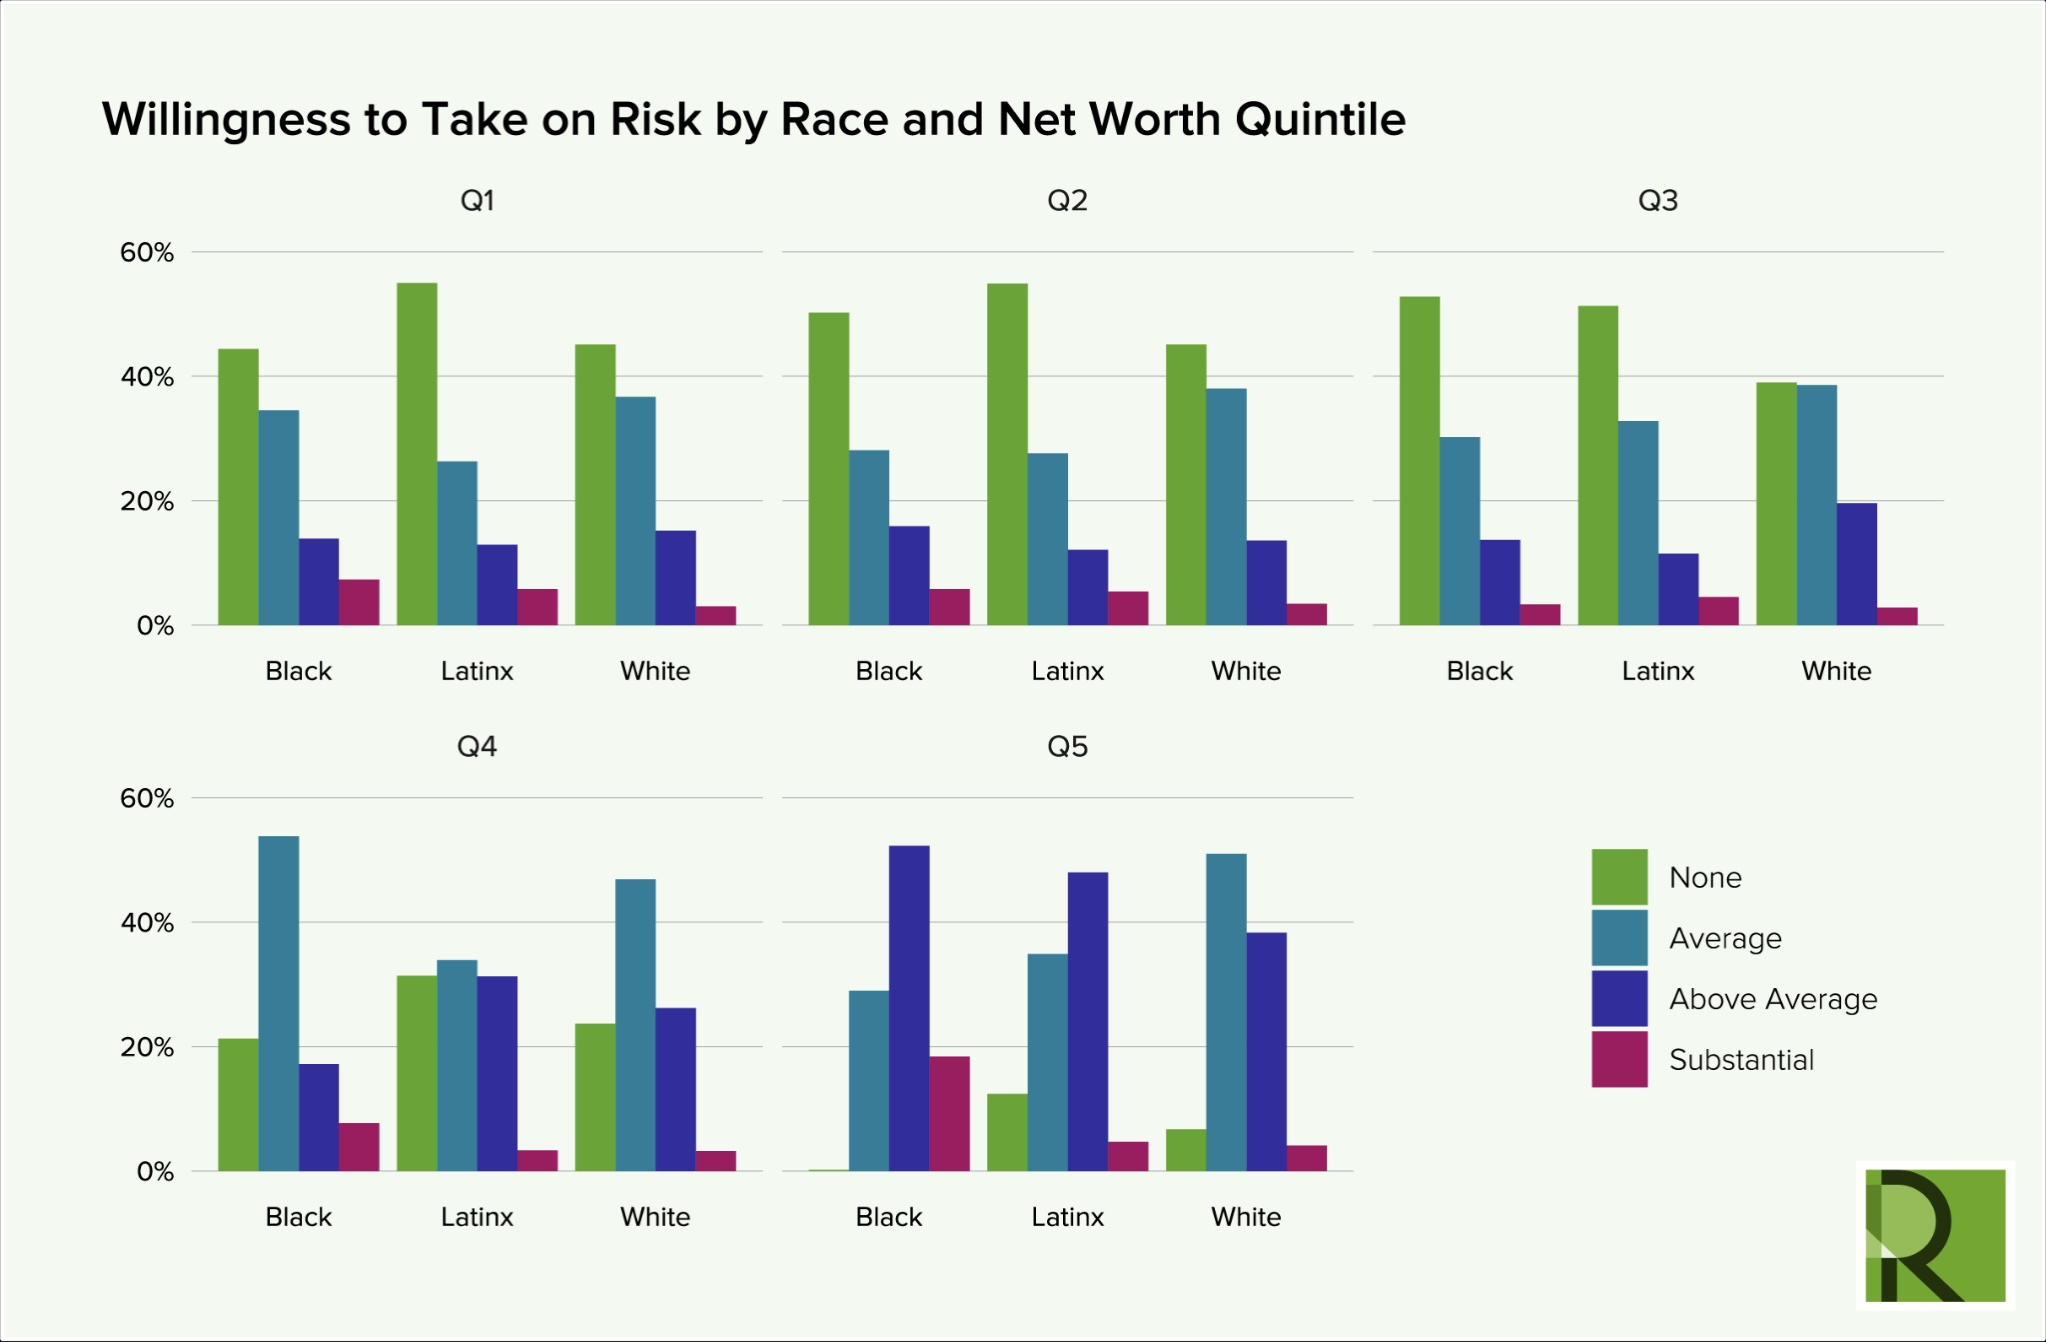
The highest net worth holders also reveal some unexpected patterns. While fifth-quintile Black and Latinx respondents were most likely to be willing to take on above-average risk, White respondents were most likely to be willing to take on average risk. Furthermore, Black respondents had the highest rate of being willing to take on substantial risk by about 14 percentage points and had almost no respondents willing to take on no risk. Notably, this quintile of net worth among Latinx respondents was the least likely to have a willingness to take on no risk.
These findings suggest that with more wealth, Black and Latinx respondents do see a decline in risk aversion. In comparison, White respondents actually show less change in willingness to take on higher levels of risk with more wealth, preferring to maintain average levels of risk instead.
Patterns by income were similar for the lower quintiles across race, as shown in Figure 2. The major difference emerged for those in the fifth income quintile. Average risk was the highest percentage of respondents for all racial groups. However, this was closely followed by above-average risk only for Black and White respondents. Latinx respondents in the fifth income quintile had a higher response of willingness for no risk than the other racial groups, which was equal to their willingness to take on above-average risk at 18 percent. Latinx respondents also had the highest willingness to take on substantial risk at about 9 percent. This suggests that risk tolerance is a range rather than a category in opposition to risk aversion that varies even among those with the highest theoretical ability to save and invest.
Figure 2
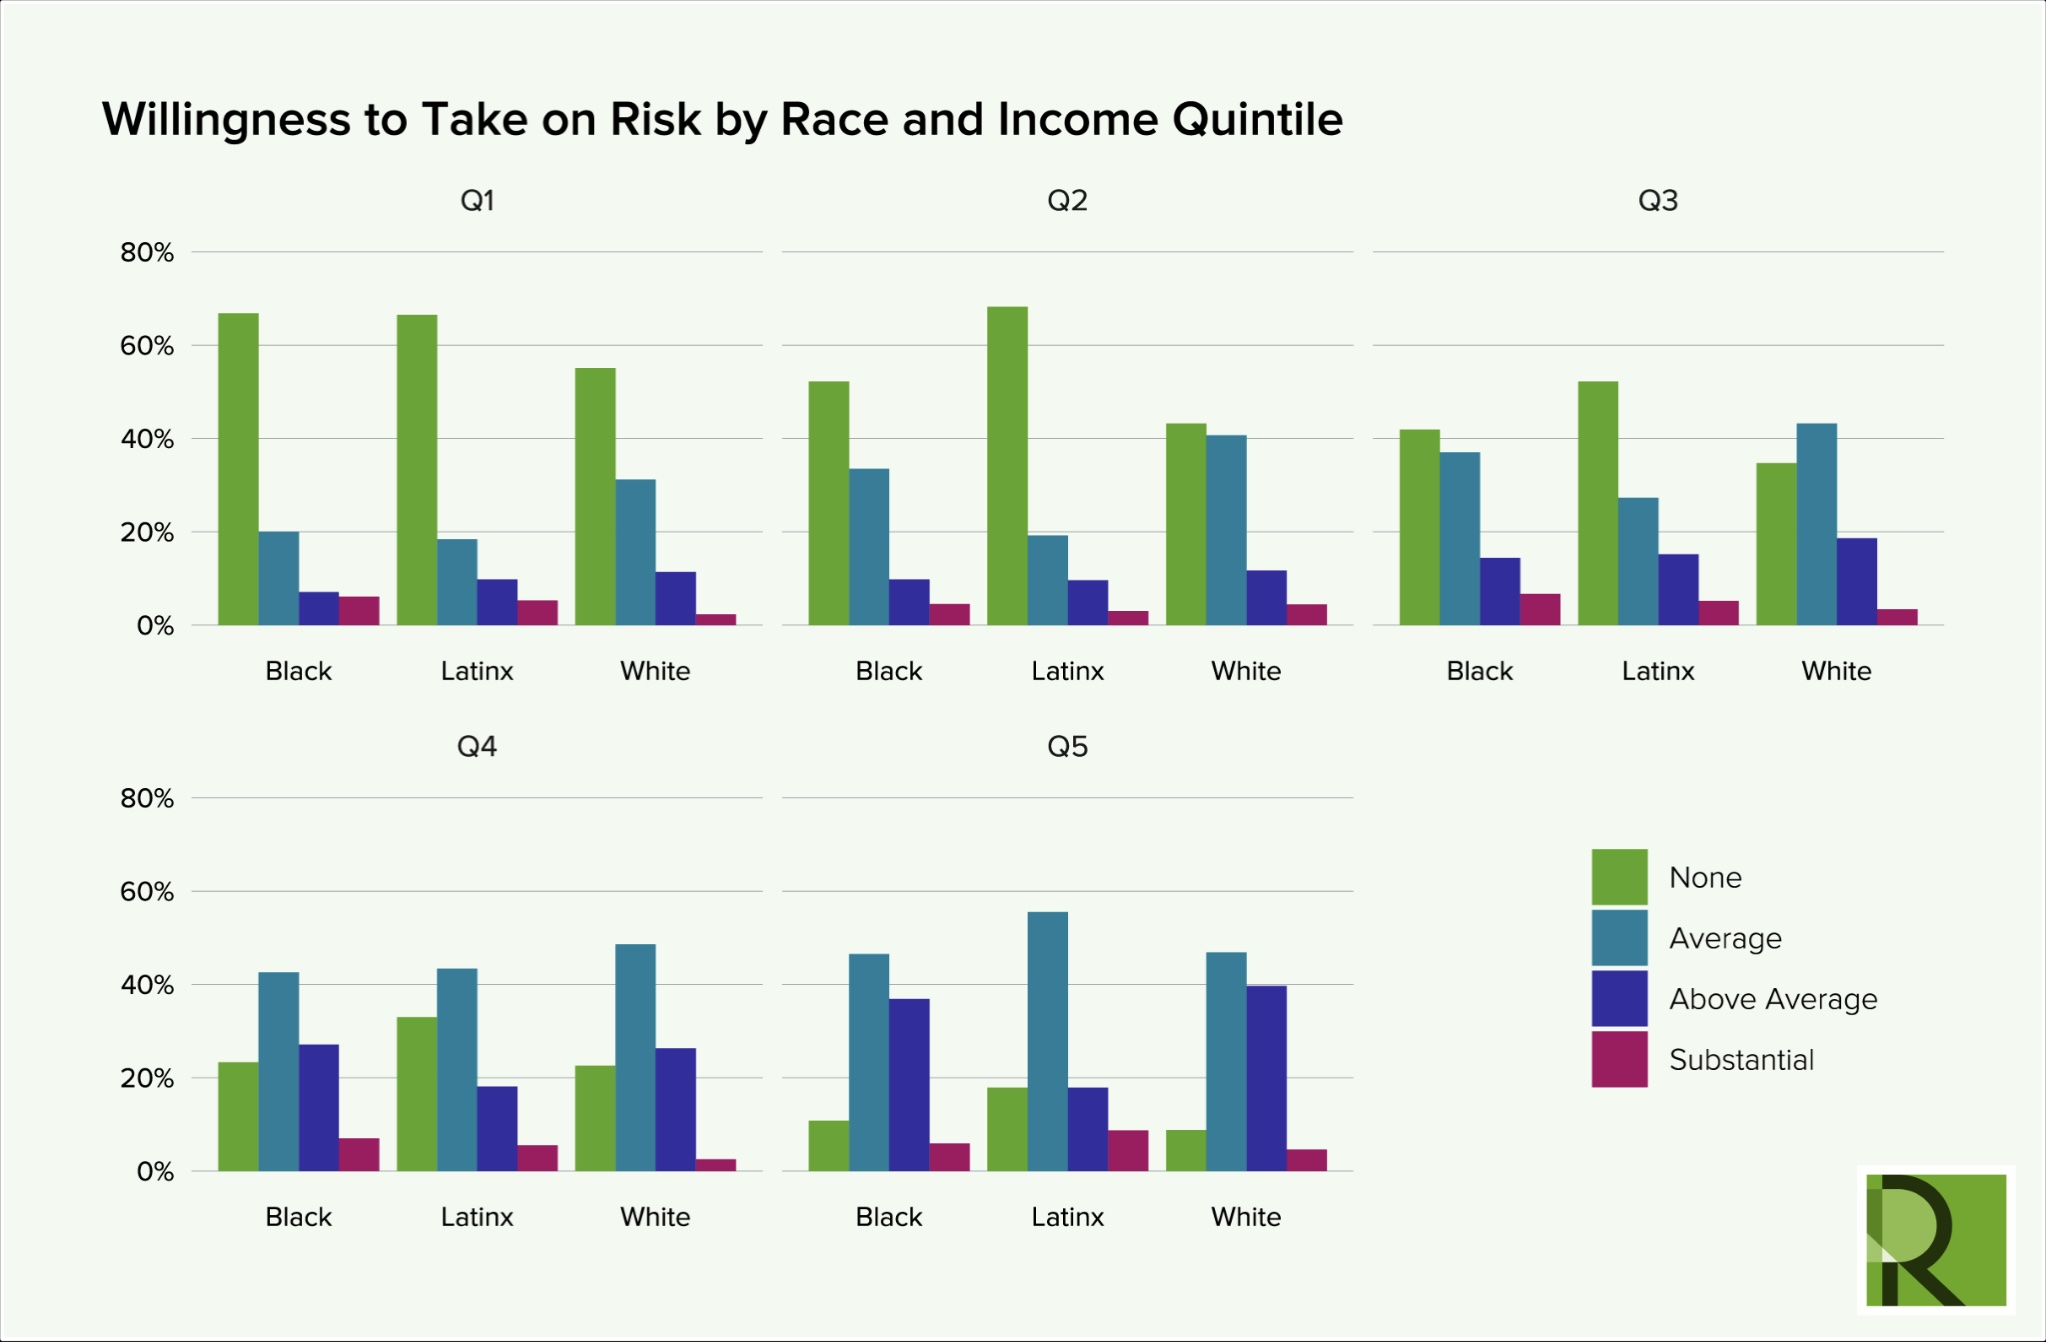
These racial differences by income neglect to account for the wealth cushion that respondents hold and variation within income categories. However, it does highlight again that with more income and theoretically more money to spend or invest, respondents of all racial groups have a higher willingness to take on risk.
Figure 3 shows the results by educational attainment (including less than a high school diploma, high school diploma or equivalent, and college education or more) and race. Again, there is a consistent pattern of more willingness to take on risk with more education across the racial categories. In this case, White respondents do seem to be even more willing to take on risk with more education than Black and Latinx respondents. With a high school diploma, White respondents were almost equally as likely to respond that they would take on average risk as no risk, whereas Black and Latinx respondents were most likely to be willing to take on no risk. This is likely related to White respondents with high school diplomas holding more in wealth than their Black and Latinx counterparts (Oliver and Shapiro 1995).
Figure 3
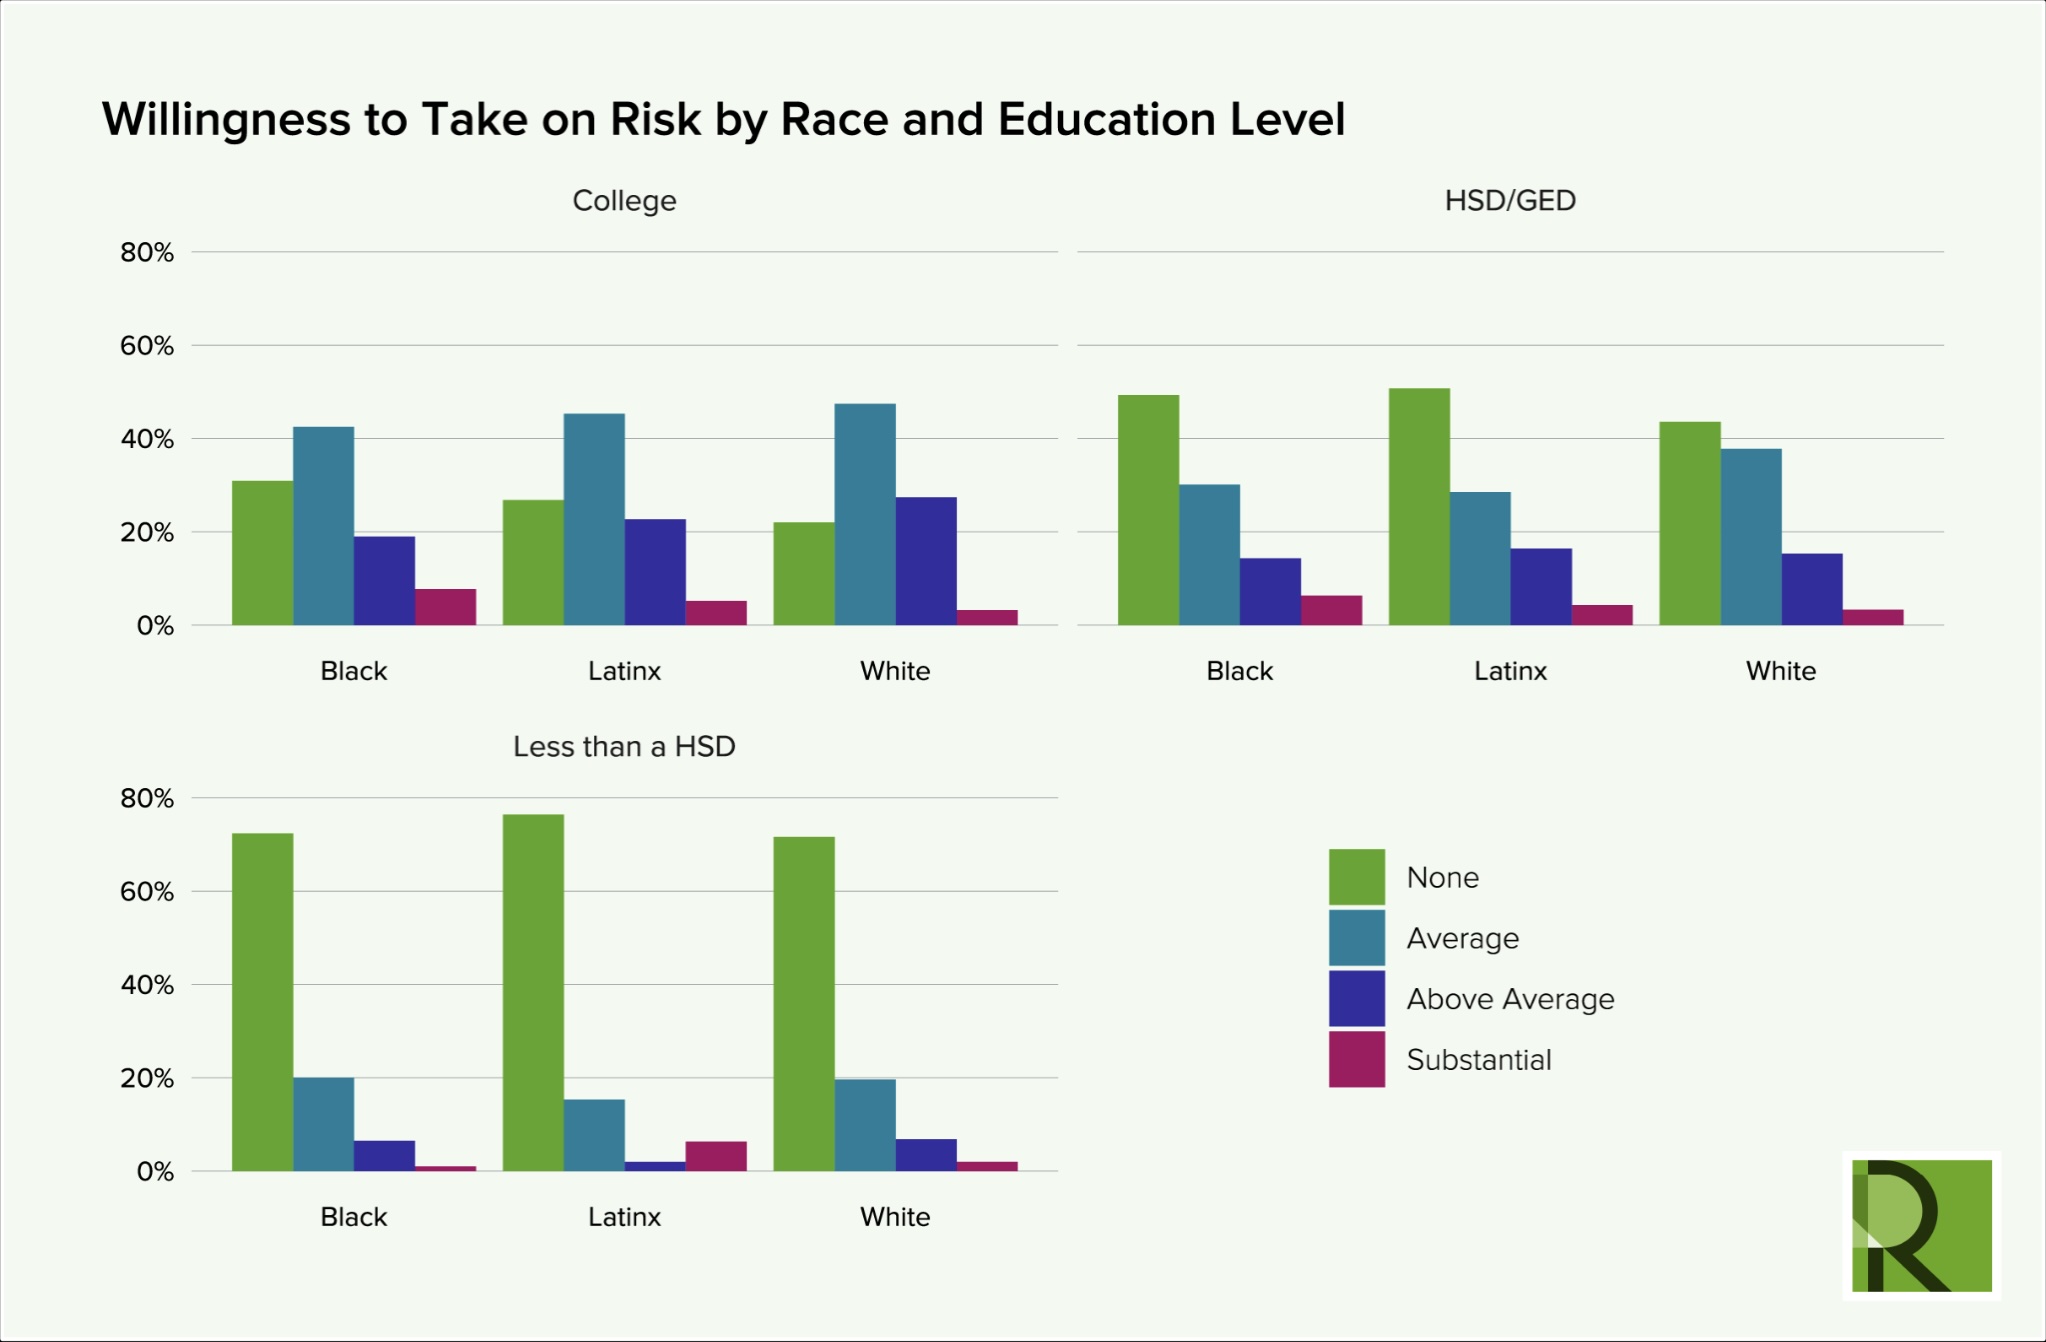
Among the college educated, who prior studies have found to be more willing to take on risk, the most common response for all racial groups was average risk. For Black and Latinx respondents, this was followed by no risk. For White respondents, average risk was followed by above-average risk at 27 percent and no risk at 22 percent. While substantial risk was the least common response, it was highest for Black respondents followed by Latinx respondents.
These descriptive analyses illustrate that respondents with higher socioeconomic status do show more risk willingness regardless of race, but that most of that is an increase in willingness to take average or above-average risk. Willingness to take on substantial risk, an indicator of risk tolerance, was not consistently limited to White respondents. In fact, Black and even Latinx respondents with higher socioeconomic status had higher rates of willingness to accept substantial risk depending on how socioeconomic status was measured.
These racial differences in socioeconomic position are likely to matter because not everyone is able to invest or take on risk due to their financial position. Racial differences in risk aversion may actually be capturing socioeconomic differences in the distribution of the SCF sample by race. Since the concept of risk tolerance assumes that the person or household can afford to lose some amount of money, we need to account for racial disparities in socioeconomic position in order to understand risk aversion or tolerance.
In fact, with a simple multinomial logistic regression to predict risk willingness with either racial demographics or socioeconomic status (including net worth, income, and education), I find that race provides less explanatory power. As shown in Table 1, higher net worth is associated with a higher likelihood of having above-average or average risk willingness and lower likelihood of risk aversion (no risk). While the results are less robust with the income variables, there is a similar pattern. Lastly, more educational attainment is associated with more willingness to take on above-average and average risk, and negatively associated with risk aversion.
This socioeconomic model only explains about 10 percent of risk willingness. However, the race model only explains 1 percent. Black and Latinx respondents were less likely to have above-average and average risk willingness than White respondents, but Black respondents were also less likely to be risk averse than White respondents.
The descriptive statistics and regression models above demonstrate that risk willingness is not simply a factor of race, but also one of socioeconomic status. Class variation by race is likely to significantly explain racial differences in risk aversion and willingness.
Implications of the Race-Socioeconomic Status Interaction
The variation across the results of the three descriptive analyses above highlights how socioeconomic status might interplay with risk aversion and tolerance in different ways. People with more net worth have less to lose with risky investments and may generally be more willing to take on above-average and even substantial risk because of that. In contrast, those with less net worth are logically less willing to risk all of their assets to maybe make more money. Similarly, people with higher incomes have more money to save and invest, and can afford to not see a return on all investments, but people with lower incomes do not have that luxury. Lastly, those with more education are likely to also have higher income, but may also be carrying more debt due to their college education, which may explain the lower rates of willingness to take on even average risk in the results above due to the realities of student loan bills.9 Those without a high school diploma are also likely to be financially unable to take on higher risk investments due to the potential for loss and their higher likelihood of working in lower-wage jobs. Importantly, people are likely to account for multiple aspects of their socioeconomic status in responding to the risk willingness question, which is not accounted for in the analyses above. That is, they are likely to consider how much they make, how much they have saved or invested, how much they could potentially make in the future, and how much debt they hold.
When understood this way, the relationship between socioeconomic status and willingness to take on risk suggests that willingness to take on risky investments is a calculation based on logic, reason, and reality for most Americans. Rather than being a feeling (e.g., I am comfortable taking on risk) or desire (e.g., I want to take on risk), the clear patterns of increased willingness with higher socioeconomic status across measures suggests that willingness is capturing an ability (e.g., I am in a financial position to take on risk). The part of this rational decision that we have yet to fully understand, however, is what that calculation is based on, which would explain the difference in what “average” and “above-average” or “substantial” risk means to survey respondents.
The relationship between socioeconomic status and willingness to take on risk suggests that willingness to take on risky investments is a calculation based on logic, reason, and reality for most Americans.
Ultimately, what is being interpreted as risk aversion or tolerance is unclear from the measures itself. Racial differences in risk aversion and tolerance may not actually be about differences in knowledge or information, as suggested in the prior literature (Anvari-Clark and Rose 2023; Brimmer 1988; Shin and Hanna 2015; Badu, Daniels, and Salandro 1999; Gutter and Fontes 2006; Hanna, Wang, and Yuh 2010; Yao, Gutter, and Hanna 2005). The survey questions on risk aversion themselves do not have a clear answer that someone knowledgeable in math, business, or finance would be able to explain, because the questions are subjective. Concluding that financial education or literacy courses would “correct” risk aversion among Black and Latinx Americans is not accounting for what risk aversion measures capture.
The Real Problem Underlying Risk Aversion
The interpretation that risk aversion is the result of a lack of education or knowledge puts the onus on individuals to fix the racial wealth gap. It ignores that individuals interact with and respond to institutions like the labor market, family, and financial institutions.10 Concluding, for example, that “individual choices” are “the reason for portfolio differences between Black and White households” (Badu, Daniels, and Salandro 1999, 144) blames individuals for not making the “right” decision about where to invest their money without understanding the context in which those decisions were made.11 While many studies do reference the structural issues that low-income people face that affect their ability to invest in risky assets, they still focus on individual-level processes of behavior and decision-making to explain differences (Han et al. 2024).
These interpretations also assume that behaviors and attitudes of the White middle class are the gold standard that Black and Latinx Americans should replicate, rather than understanding how not just socioeconomic position but racism and immigration status contribute to how Americans navigate their finances. Assuming what is best for White middle-class Americans is best for Black and Latinx Americans not only ignores that Black and Latinx Americans face discrimination in labor and financial markets, but assumes that Black and Latinx Americans have the same financial priorities as White Americans. For example, Black and Latinx Americans are more likely to financially support friends and family members than White Americans, whether due to having more low-income connections or holding more financial responsibilities for others (Heflin and Pattillo 2006; Chiteji and Hamilton 2002; Keister, Vallejo, and Borelli 2015). Instead, we might turn back to a “safety-first” interpretation of how some Americans approach financial decisions, allowing space for the rational decision of avoiding risk (Pyle and Turnovsky 1970).
These interpretations also assume that behaviors and attitudes of the White middle class are the gold standard that Black and Latinx Americans should replicate, rather than understanding how not just socioeconomic position but racism and immigration status contribute to how Americans navigate their finances.
Ultimately, these methodological and theoretical issues in the prior literature lead to a misdirection for policy recommendations and interventions. Too often, the response to disparities in wealth is to “correct” Black and Latinx Americans’ thinking to make them more risk tolerant through interventions like financial literacy (Anvari-Clark and Rose 2023; Shin and Hanna 2015; Gutter, Fox, and Montalto 1999; Hanna and Lindamood 2008). Instead, we need to better understand what risk aversion really means and address the fundamental issues that contribute to it—such as financial instability, income inequality, and the racial gaps in wealth and debt. None of these underlying issues are produced by individual behavior or decisions, and so none of them can be addressed with individual-level interventions.
Footnotes
- Some scholars think of risk willingness as the product of risk aversion (Hanna and Lindamood 2008; Yao, Gutter, and Hanna 2005), but I refer to risk willingness in this brief as the other side of the spectrum from aversion ( which also means unwillingness). ↩︎
- The Survey of Consumer Finances is a nationally represented survey collected every three years to assess wealth holdings and attitudes towards finances among Americans. ↩︎
- Some scholarship measures risk aversion based on holding risky assets like stocks or business assets (Derenoncourt et al. 2024; Shin and Hanna 2015; Brimmer 1988; Choudhury 2001; Gutter and Fontes 2006; Coleman 2003; Gutter, Fox, and Montalto 1999; Hanna and Lindamood 2008; Hanna, Wang, and Yuh 2010), but I specifically focus here on the measure of risk aversion as an attitude. ↩︎
- While commonly used in studies of risk aversion, this measure is distinct from more formal measures such as the Arrow-Pratt coefficient of relative risk aversion. ↩︎
- For an exception to this, see Han et al.’s (2024) study which uses specific figures of risk and gain to assess risk aversion, and work on risk and time preferences using lottery payments such as Anderhub and Güth (2019). ↩︎
- This seems likely to explain the unclear relationship between the risk scale responses and the risk willingness categories seen in Appendix Figure 1. ↩︎
- See Gutter and Fontes (2006), Hanna, Wang, and Yuh (2010), and Coleman (2003) for exceptions. ↩︎
- I use the survey weights to provide nationally represented figures. ↩︎
- A similar argument likely applies to homeownership. ↩︎
- See Derenoncourt et al. (2024) for an exception in their analysis of how unemployment risk contributes to portfolio choice differences between Black and White Americans. ↩︎
- It also assumes that stock returns for Black Americans could exceed returns to White Americans if only Black Americans invested more in stocks, an assumption that is far-fetched at best. ↩︎
Appendix
Figure 1
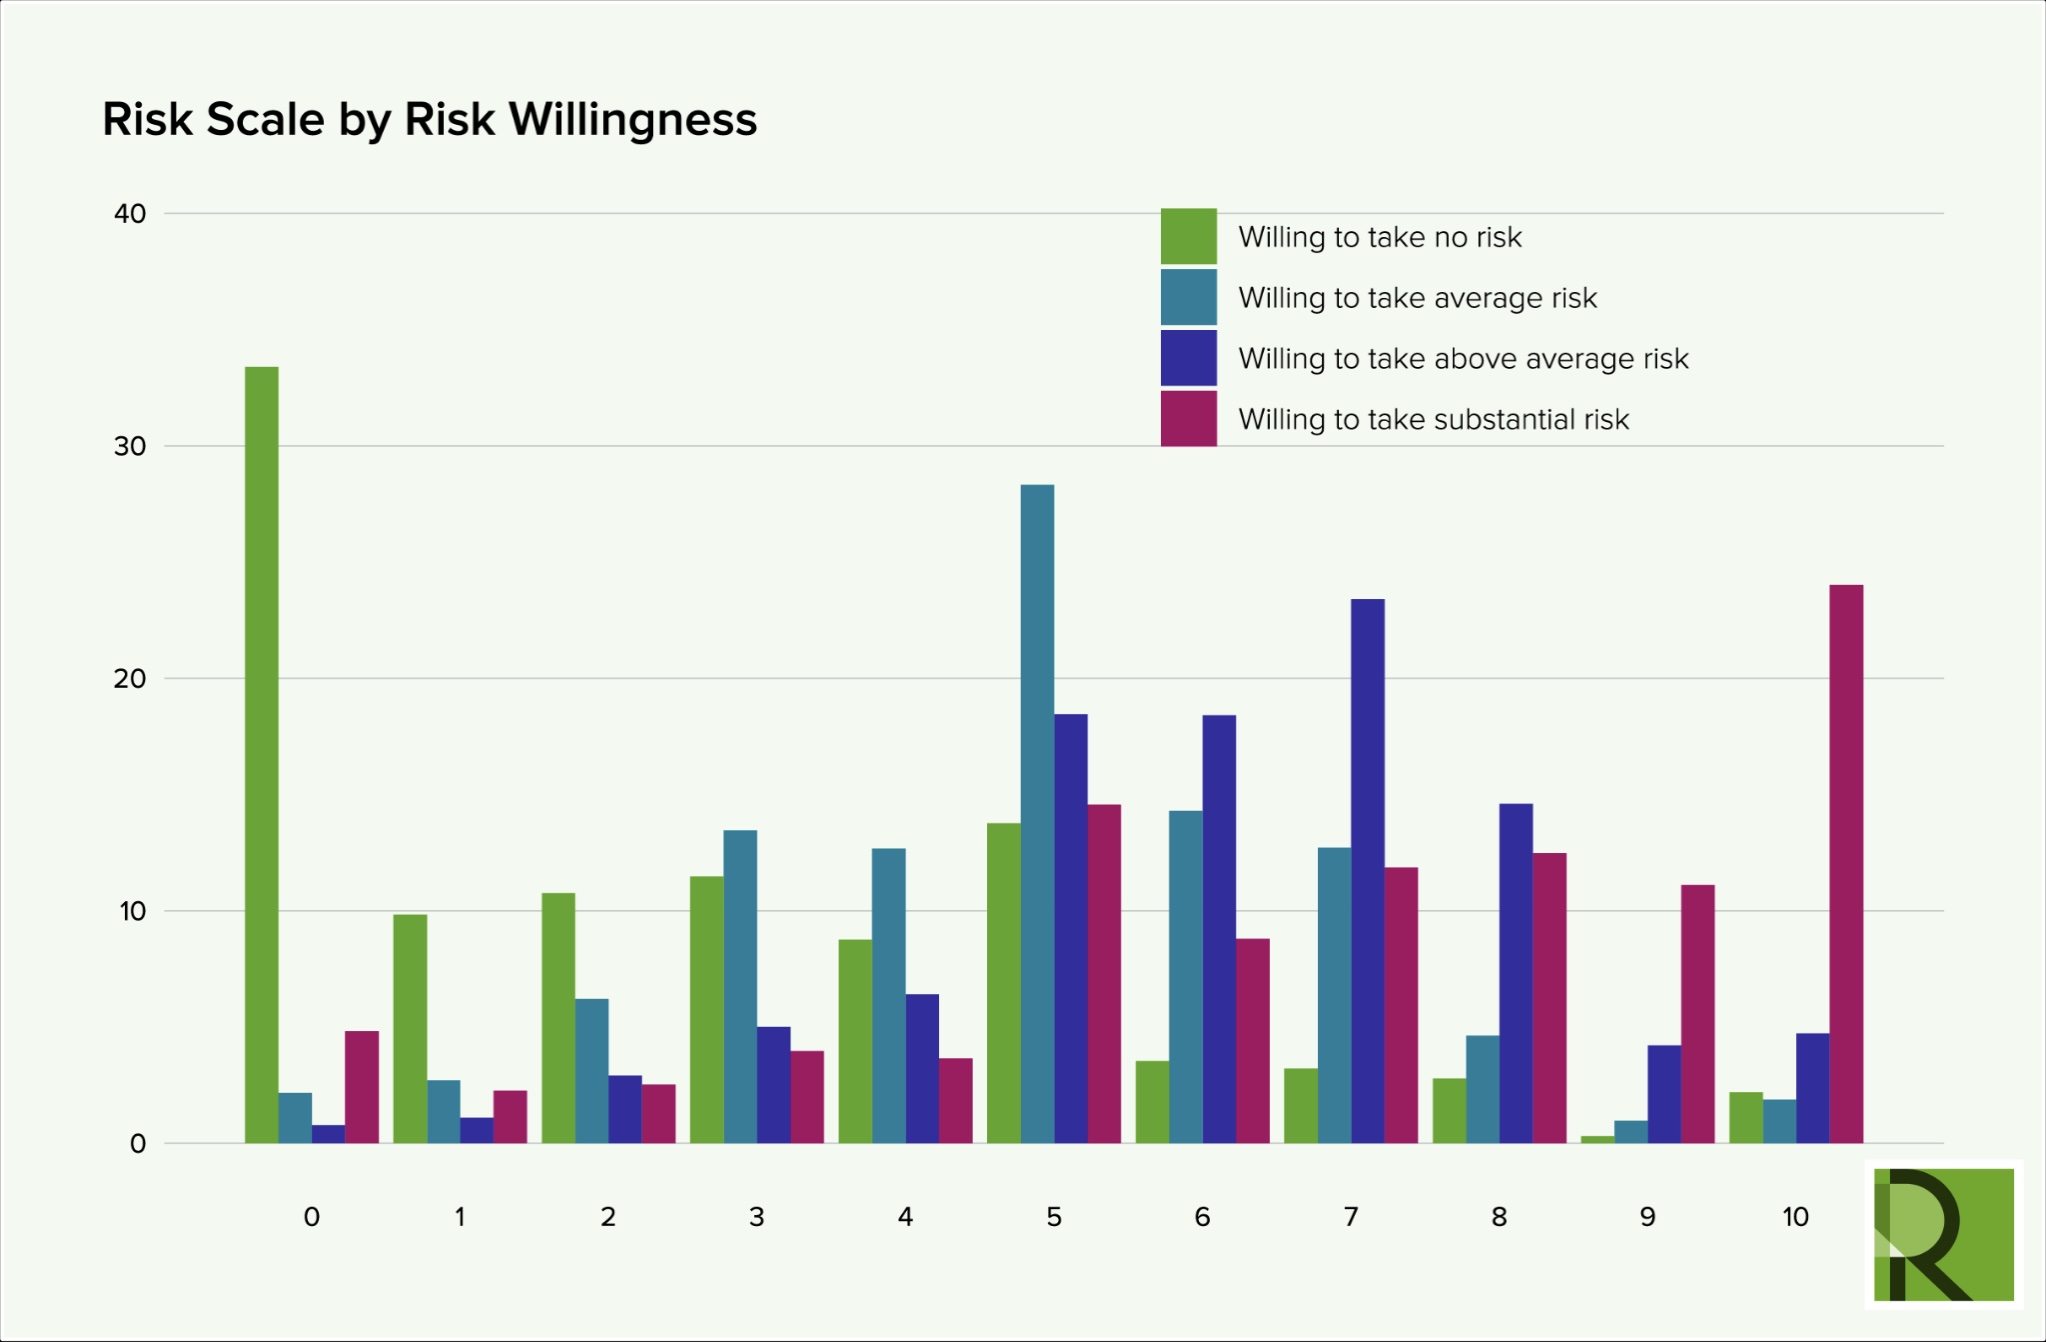
While there are various ways to measure risk aversion or tolerance, other commonly used measures also produce unclear results. For example, the graph above shows the relationship between respondents’ answers to a risk tolerance scale question (from 1–10) and their willingness to take financial risks described in the brief, both from the Survey of Consumer Finances. While respondents’ categorical responses align with their scaled responses at 0 (no risk willingness) and 10 (high risk willingness), the relationship is not necessarily consistent with expectations at the other levels of response.
Suggested Citation
Rucks-Ahidiana, Zawadi. 2025. “What “Risk Aversion” Gets Wrong About the Racial Wealth Gap.” Roosevelt Institute, September 11, 2025.
Acknowledgments
The author would like to thank Louise Seamster, Stephen Nuñez, Michael Madowitz, Suzanne Kahn, Aastha Uprety, Noa Rosinplotz, and Claire Greilich for their feedback, insights, and contributions to this paper. Any errors, omissions, or other inaccuracies are the author’s alone.
Related Resources
Author