The US Economy Is Still on the Path to a Soft Landing
July 10, 2023
By Justin Bloesch, Mike Konczal
Since last fall, we have advocated the view that a “soft landing” is possible: With an appropriate amount of monetary policy tightening and some patience, the economy can return to an equilibrium with moderate inflation and strong but sustainable wage growth—without a significant increase in the unemployment rate. However, the Federal Reserve continues to point to the labor market as “too tight” and projects that unemployment must rise to fight inflation. We argue instead that recent inflation and labor market data are very much consistent with a soft landing, and that inflation can continue to fall without a weakening in the labor market.
Our case for a soft landing is built around two arguments:
- Common measures of labor market tightness that use the ratio of job openings to unemployment can be misleading due to pre-pandemic time trends in the JOLTS job opening series. Removing time trends reveals that the labor market is only slightly tighter than it was in 2019 and is unlikely to be a large source of inflation going forward.
- Wage growth in the Average Hourly Earnings series continues to decelerate, even after accounting for composition issues, bringing wage growth close to pre-pandemic growth rates.
The inflation measure that the Fed cares about most, the personal consumption expenditures (PCE) index excluding food and energy (i.e., “core” PCE), has remained high over the past year—at around 4.5 percent. After falling in late 2022, the core Consumer Price Index (CPI) has remained elevated in 2023 at around 5 percent. However, it’s already well known that this reflects various sticky features such as housing, which lags dynamics in the real economy. Meanwhile, headline inflation has fallen dramatically as the shock from the war in Ukraine has passed.
There are various indicators both that inflation is likely to fall in the near term, and that long-term risks of persistent inflation are subsiding. The core Producer Price Index for final demand, which has led inflation through this cycle, is already down to 1.1 percent year-over-year growth. Expectations of inflation both by consumers and by firms have fallen dramatically, suggesting that risks of persistent inflation dynamics are also subsiding.
This has all occurred as the unemployment rate fell from 4 percent in January 2022 to 3.6 percent last month. The labor force participation rate and the employment level are actually above the pre-pandemic forecast made by the Congressional Budget Office (CBO). So, how has inflation begun to fall while the labor market has been so strong?
The Job Openings Rate Overstates Labor Market Tightness
Prominent economists, including Olivier Blanchard, Ben Bernanke, and Larry Summers, believe that the labor market is too tight (Blanchard et al. 2022; Bernanke and Blanchard 2023). Their most commonly cited metric is the ratio of vacancies (or job openings) to the number of unemployed workers, often dubbed the V/U ratio. Federal Reserve Chair Jerome Powell has said that the Federal Open Market Committee (FOMC) hopes to see a V/U ratio of 1. Blanchard and Bernanke predict a V/U ratio of 1.2 would lead inflation to fall and settle around 3 percent, which they view as the upper bound of an acceptable range. The V/U ratio is currently 1.6 after being around 2 last year.
There has been no shortage of debate about the JOLTS job openings (both in the level of job openings, as well as the V/U ratio) series as a measure of labor market tightness (Mui 2022; Michaillat 2023). The Beveridge Curve is well known for shifting out during economic recoveries; it has done so in most recoveries since 1950 (Diamond and Sahin 2014). Traditional arguments about V/U ratios pay poor attention to job-to-job transitions (Cheremukhin and Restrepo-Echavarria 2022; Andolfatto and Birinci 2022); a high level of job-to-job transitions has been one of the most important and beneficial features of this labor market recovery. There are also reasons to believe that at high levels of V/U, the Beveridge Curve is quite steep (Figura and Waller 2022)—an empirical prediction that came to pass as vacancies fell 1.1 percentage points over the past year while unemployment has remained steady.
But there is another reason to be skeptical about the idea that V/U requires an increase in unemployment: The JOLTS job openings series has not had a stationary relationship with any other labor market variable since 2000, be it quits, the unemployment rate, or wage growth. We believe that correcting for time trends is important for interpreting the JOLTS job openings number.
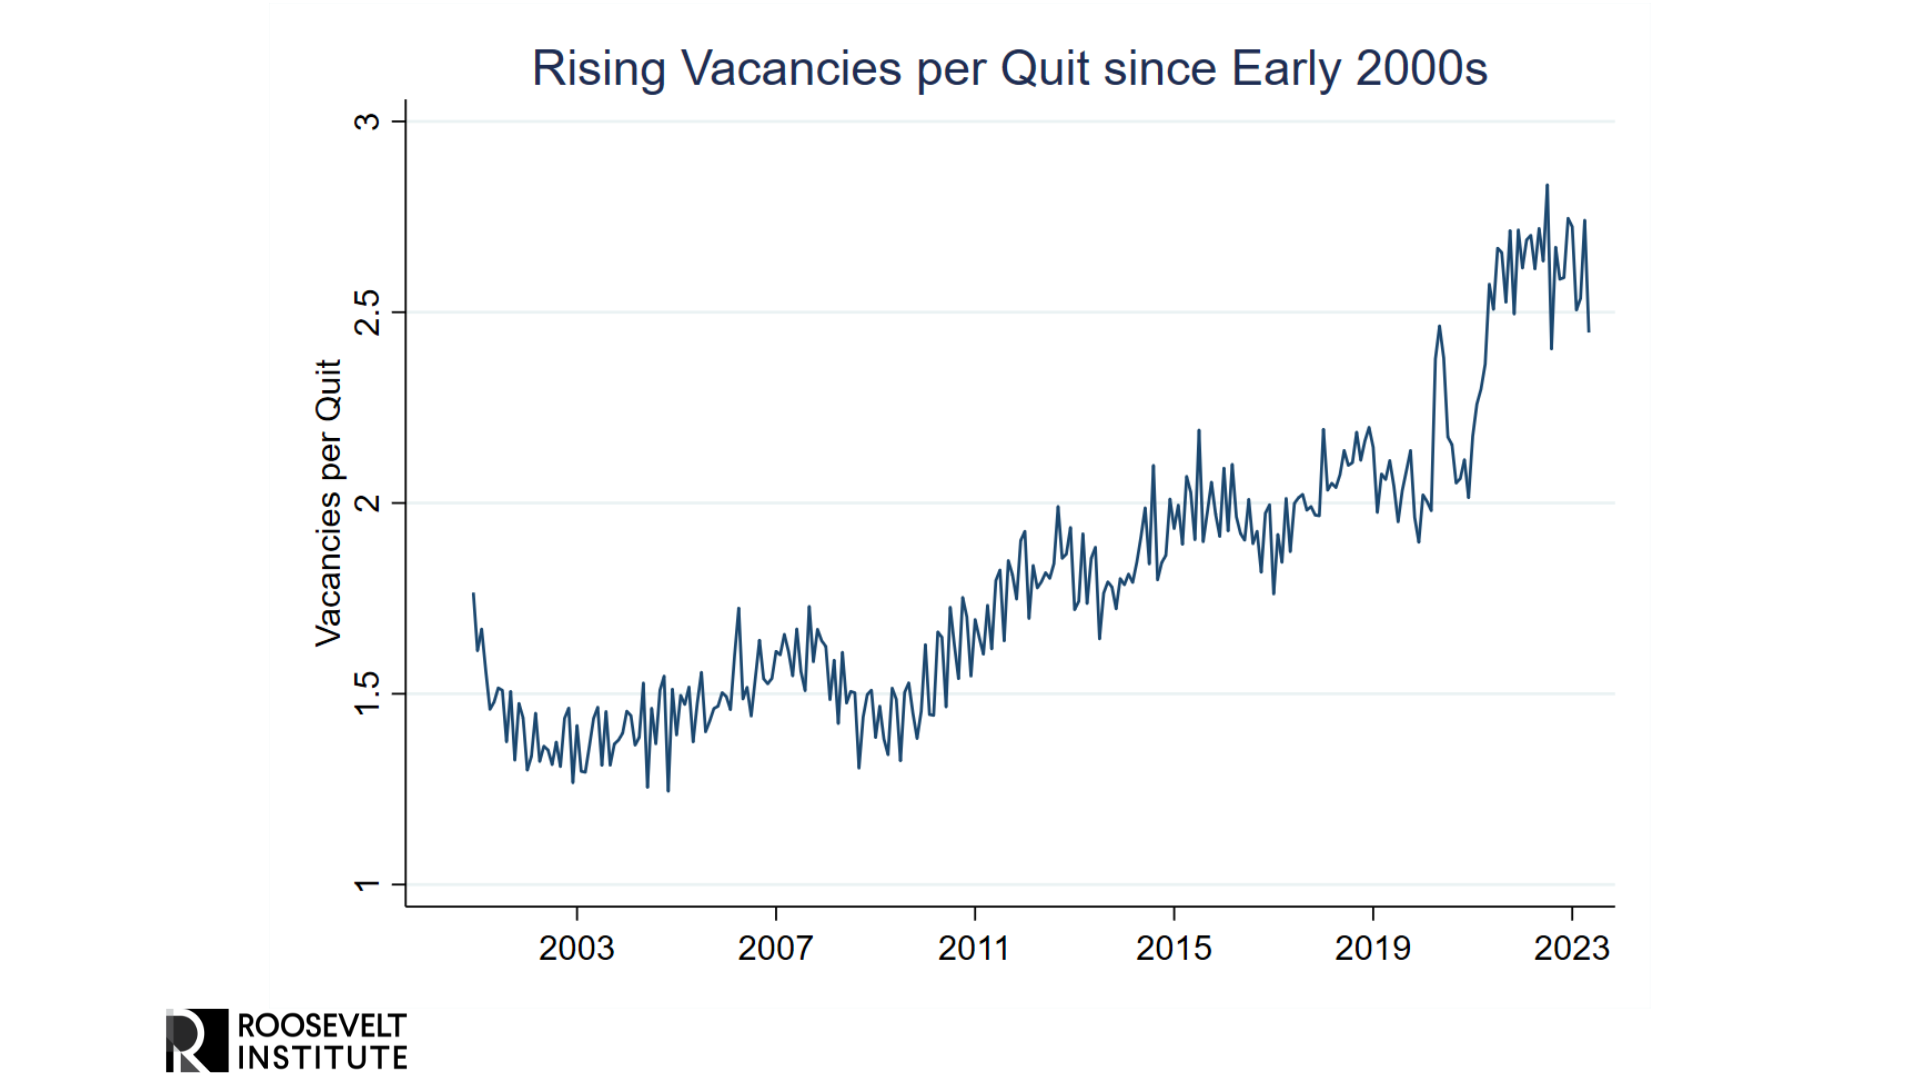
To see the concern, consider the ratio of JOLTS job openings to JOLTS quits. From 2001 to 2005, there were around 1.4 vacancies per quit. From 2006 to 2019, this ratio increased to 1.8. Today, there are 2.4 vacancies per quit. The time trend in this relationship is clearly evident before the COVID-19 pandemic, and to our knowledge there is no credible explanation for why vacancies should be less effective in poaching workers than in the past.1
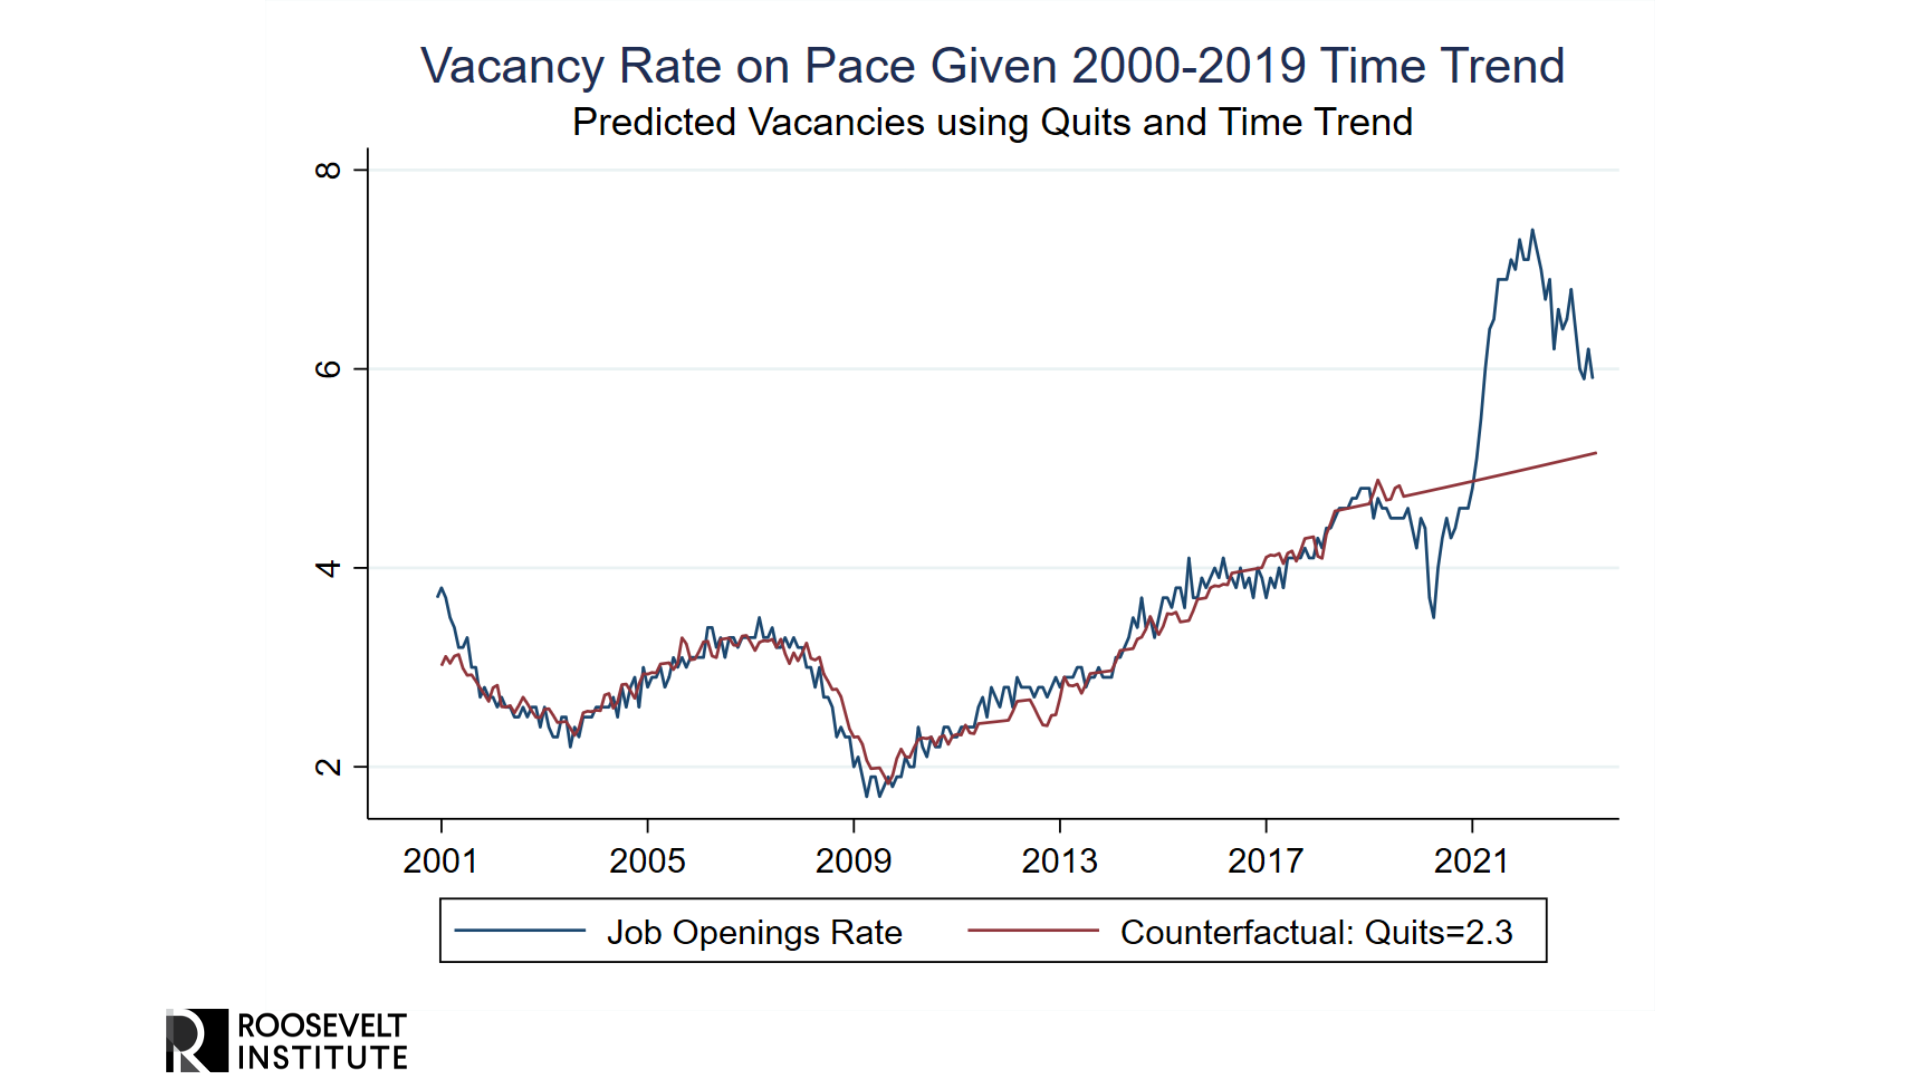
Given the trend in vacancies to quits, what V/U ratio would be consistent with a labor market as tight as before the pandemic? If the quits rate had stayed at the pre-pandemic average of 2.3, we find that the job openings rate would be 5.1, taking into account the time trends in job openings relative to quits. With a pre-pandemic unemployment rate of 3.6 percent, a V/U ratio of 1.4 today would mean the labor market is as tight as it was prior to the pandemic.
But is the pre-pandemic labor market really the tightest the labor market can be without runaway inflation? We doubt it. Throughout the 2010s, Fed officials, economists, and commentators alike chronically underestimated the potential of the labor market, projecting large structural declines in labor force participation that were reversed as the economy continued to recover. In 2018–2019, the unemployment rate fell below 4 percent and inflation was stable. Given the beneficial effects of tight labor markets on wages in low-wage occupations, Black-white employment gaps, and labor force participation, maintaining labor markets that are only a bit tighter than they were before the pandemic promises meaningful reductions in inequality. Furthermore, wage growth often appears more related to measures of churn and employment growth than to the level of employment, and so we believe the labor market can stay tight while gradually drawing more workers into the labor force.
Wage Growth Continues to Slow Down
One of the key elements of a soft landing is that wage growth could decelerate without an increase in unemployment. While wage growth is far from the only source of inflation, it would be hard to get close to 2 percent inflation if nominal wages continued to grow at their peak rate of 6 to 7 percent. Fortunately, wage growth has been gradually cooling to a level that is still strong, without any rise in unemployment.
A continual challenge with getting a read on wage growth is data: The highest quality measure of wages is the Employment Cost Index (ECI), but this series is released only once per quarter. The ECI also has a good deal of noise quarter to quarter, which makes it hard to use to identify turning points at three- to six-month horizons.
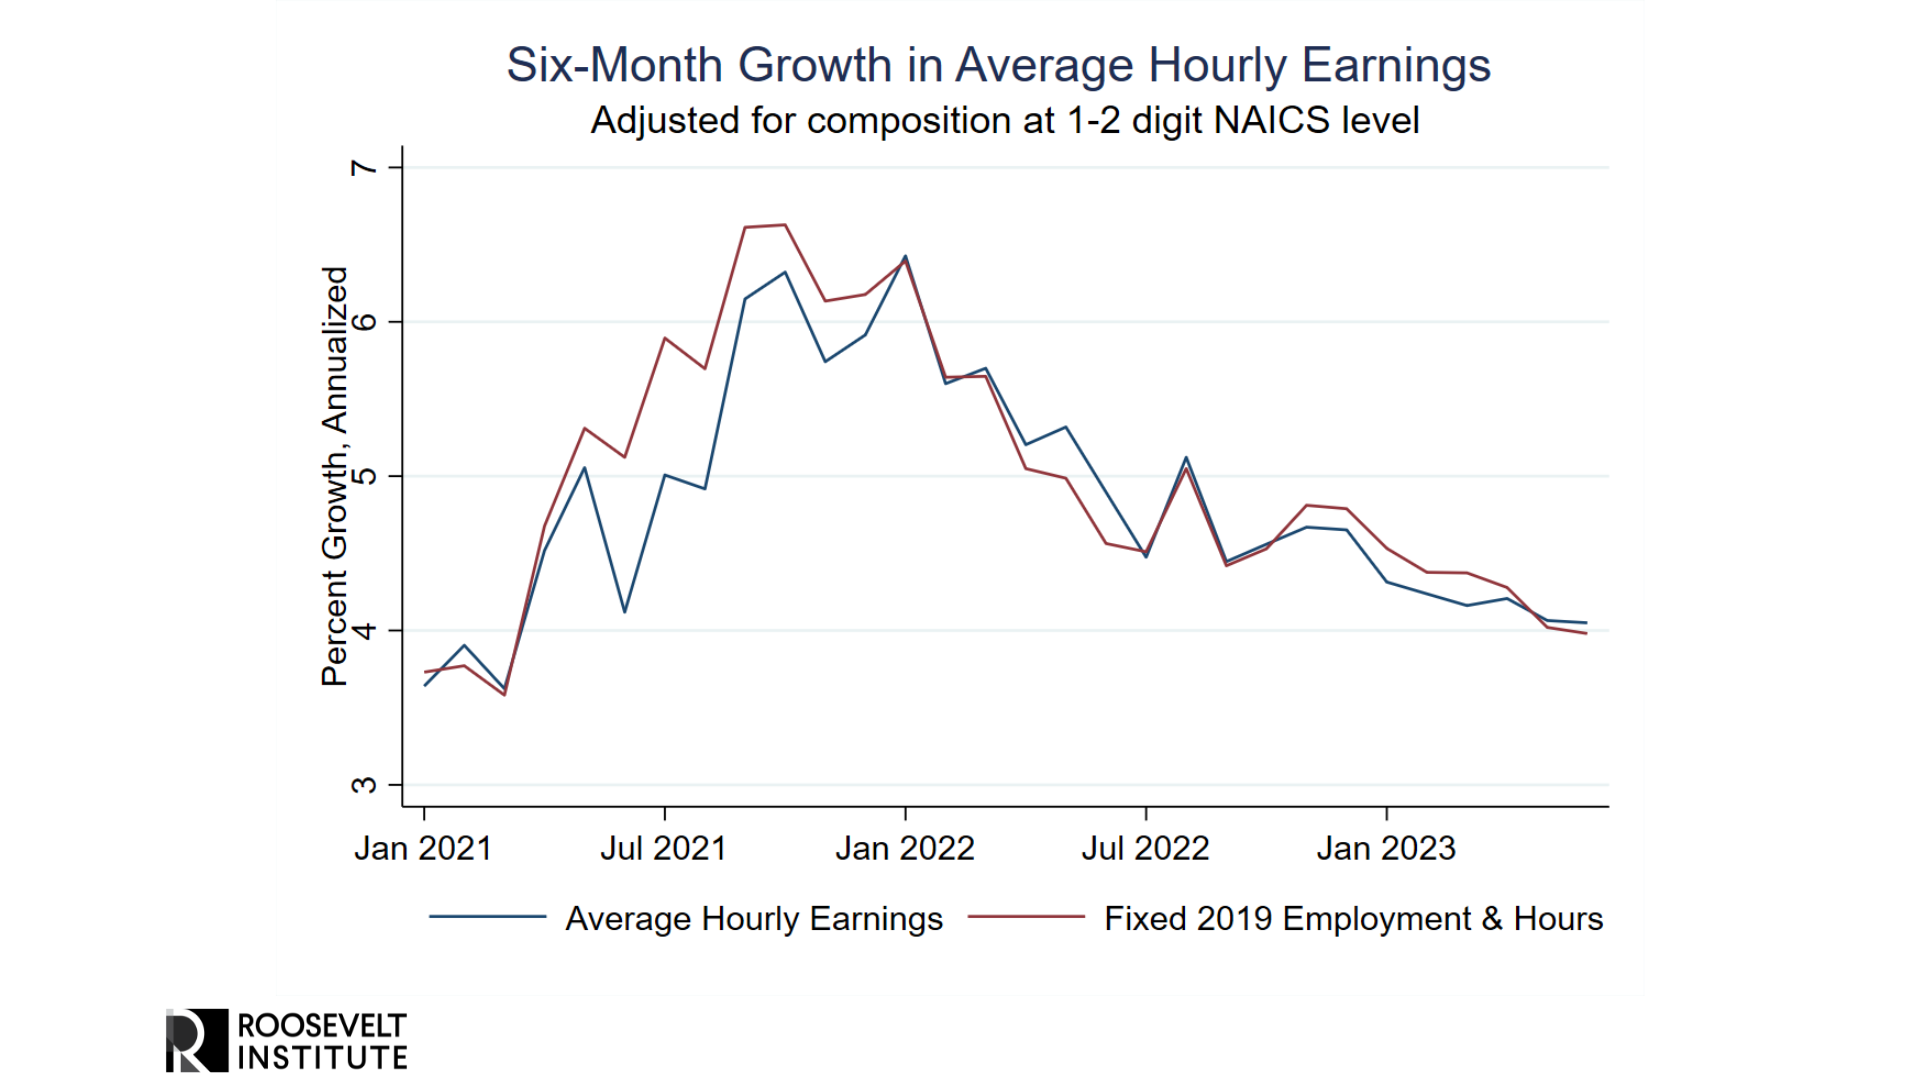
There are other measures of wage growth, each with their own advantages and disadvantages. Most prominent among them is the average hourly earnings series, which is notorious for compositional issues: The headline wage growth number is influenced by whether employment in high-wage or low-wage industries is growing faster. To control for some of these composition issues, we compute growth in average hourly earnings, holding employment and hours across industries fixed at 2019 levels. This helps us control for different employment growth rates in high- and low-wage industries, but it will not account for compositional changes within these industries (industries here defined at the level of manufacturing, leisure and hospitality, information, etc.).
We find that changes in composition at these high-level industries do not meaningfully change the story of decelerating wage growth in the average hourly earnings series. If anything, composition biased down wage growth the most in 2021, when low-wage employment and hours in leisure and hospitality were recovering the fastest from their steep drop in 2020. However, in recent months, different employment growth rates across these industries have affected total wage growth by only a few tenths of a percent.
The pace of wage growth in the average hourly earnings series is noticeably lower than wage growth in other measures, such as the Indeed Wage Tracker, the Employment Cost Index, and the Atlanta Fed Wage Tracker, all of which imply wage growth between 5 and 6 percent. However, all of these measures show some deceleration in varying degrees.
Moreover, recent research by both the Federal Reserve Bank of San Francisco (Shapiro 2023) and the Federal Reserve Bank of Chicago (Barlevy and Hu 2023) have emphasized that wage increases are a poor predictor of future inflation. This has been generally true since 1980 (Peneva and Rudd 2017), but this research emphasizes this result when it comes to the non-housing services sector the Fed has followed. This doesn’t mean that wages and inflation aren’t connected—if prices are more flexible than wages, we’d expect to see this behavior. But if we are waiting for wages to fall as a necessary condition to assuming inflation will fall and stay low, we will be waiting too long.
Conclusion
The US economy continues on a path toward a soft landing: Inflation and wage growth continue to slow even as growth is moderately strong, workers continue to rejoin the labor force, and tight labor markets help decrease long-standing inequalities. The Fed should set its policy based on the belief that a soft land is achievable, moving with patience to allow further cooling in the economy to play itself out.
1Blanchard, Domash, and Summers argue that a high V/U ratio implies lower matching efficiency and a higher natural unemployment rate (u*). However, the trend toward higher vacancy rates was clear in the decade after the 2008 recession, when the unemployment rate fell to 3.5 percent and inflation was persistently low. This low inflation is clearly inconsistent with falling matching efficiency and a rising u* prior to the pandemic.
Roosevelt Author's

Justin Bloesch
Former FellowJustin Bloesch is a former fellow with the Roosevelt Institute and an assistant professor of economics at the Cornell School of Industrial Relations. His work focuses on labor markets, business cycles, and inequality.

Mike Konczal
Former Director, Macroeconomic AnalysisAs former director of Roosevelt’s macroeconomic analysis team, Mike Konczal led research focused on achieving full employment, building an economy that truly works for everybody, and developing the next generation of economic ideas.