

Reaganism Broke US Tax Brackets. It’s Time To Fix Them.
September 14, 2026
By Samarth Gupta


Key Takeaways
- In recent decades, income inequality across the income distribution has exploded. From 1979 to 2022, the post-tax-and-transfer income of the top 0.01 percent grew more than six times higher than for the bottom 20 percent of earners. At the same time, the fiscal situation in the United States has worsened—with the country’s debt burden expected to skyrocket and interest payments on the debt growing in tandem.
- Policymakers should therefore restructure the tax code to double the number of tax brackets from 7 to 14, addressing both the reality of income inequality and the need for higher revenues. Far from being revolutionary, this would bring the tax code closer to historical norms: From 1916 to 1986, the US averaged more than 27 tax brackets a year and peaked at 56.
- Additional tax brackets would also give policymakers more built-in flexibility to change tax rates and income thresholds in the future under different macroeconomic and fiscal scenarios.
Introduction: Why the US Tax Code Needs More Income Brackets
Many of the defining legislative battles in Congress over the past three decades have centered on tax policy: Bill Clinton’s 1993 Reconciliation Act, the George W. Bush tax cuts, Barack Obama’s fiscal cliff compromise, and Donald Trump’s two rounds of tax cuts. But despite the fighting and headlines, the structure of the individual income tax has not changed much over this same period. The top marginal tax rate has remained between 35 and 39.6 percent, and the number of tax brackets has grown only modestly, from five to seven.
This stasis contrasts sharply with personal incomes, which have changed dramatically over the same period. In the 30-plus years since 1992, the post-tax-and-transfer incomes of the bottom 20 percent of earners grew by 67 percent. While that statistic sounds promising in isolation, it pales in comparison to the growth experienced by the top 0.01 percent of earners—whose incomes grew by an astounding 437 percent. During those decades, the richest Americans also saw their pre-tax-and-transfer incomes skyrocket. And they disproportionately benefited from the cuts to tax rates across lower tax brackets, while the top marginal tax rate changed little.
Policymakers should restructure the tax code to reintroduce more tax brackets, coupled with greater progressivity at the top end of the income distribution.
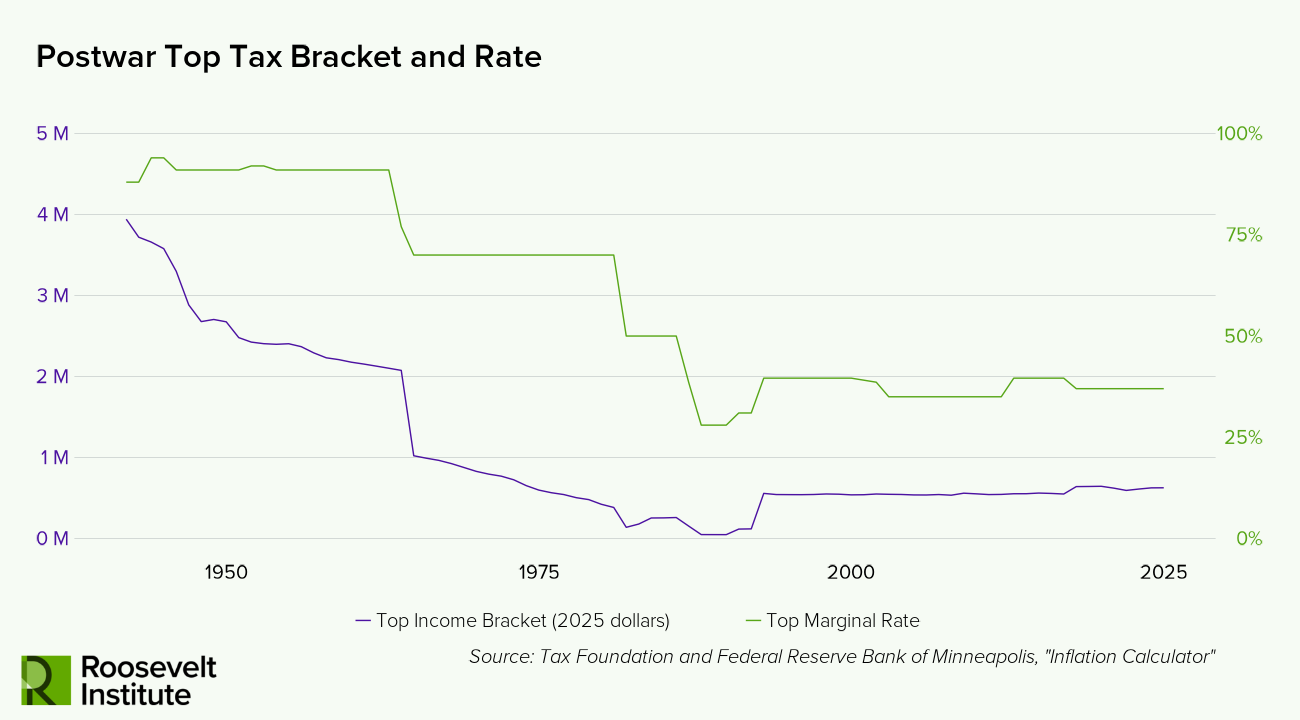
Modern taxpayers may be accustomed to a narrow band of rates and brackets, but this compression is a relatively new development in US history. From 1916 to 1986, the top marginal tax rate was, on average, 70 percent, with top rates applicable only to those making millions, tens of millions, or even hundreds of millions every year in today’s dollars. During that period, the country had on average more than 27 different federal income tax brackets each year, with as many as 56 at a time—compared with 7 federal brackets today.
Today, policymakers should restructure the tax code to reintroduce more tax brackets, coupled with greater progressivity at the top end of the income distribution. They should do this for three reasons: First, since the Reagan era, income inequality across the income distribution has exploded, with the top sliver of Americans enjoying exponentially higher incomes than the rest of the country and the bottom chunk of Americans falling further and further behind. Second, income inequality within the top end of the income distribution has skyrocketed, with income gains for the top 0.1 percent far outpacing those for the rest of the top 1 percent. Failure to adapt our tax code accordingly has resulted in a loss of vertical equity, the idea that those with higher incomes should pay higher taxes. Instead, surgeons and small business owners are now in the same bracket as Fortune 500 CEOs. Third, our country’s fiscal situation—with the country’s debt now exceeding GDP—demands more tax revenue, which these reforms can help deliver. And beyond these three reasons, more brackets will give policymakers more structural flexibility to shift the individual income tax under future economic conditions.
This brief begins by walking through major developments in the US individual income tax, contextualizing today’s tax code in different historical and macroeconomic conditions. Next, it details why more tax brackets and progressivity in the tax code at the top end of the income distribution are warranted today. Lastly, it provides options for individual income tax rates with additional brackets and counters common arguments against more progressive income taxation.
I. How US Income Tax Brackets Changed from 1913 to Today
1913–1916: The Income Tax Is Ratified
America’s income tax had several false starts. In 1861, Congress enacted the nation’s first federal income tax as a means of financing the Civil War, but it was repealed before the Reconstruction era came to a close. The income tax came around again via the 1894 Tariff Act, to help substitute for tariff revenue. However, the following year, the Supreme Court ruled in Pollock v. Farmers’ Loan & Trust Co. that the tax violated the Constitution, which, under Article I, Section 2, only allowed direct taxes apportioned among the states according to their populations.
It wasn’t until 1913 that states ratified the 16th Amendment, which allowed the income tax to take root. In the years following Pollock, populists and progressives had rallied support around an income tax, lamenting that tariffs were a consumption tax on lower-income Americans and that federal revenues should come from the wealthy. Conservatives then proposed a constitutional amendment to kill the idea. They trusted that the amendment would not be ratified by three-fourths of states. However, their trust was misplaced, as the income tax garnered popular support as a substitute for tariffs.
With the amendment ratified just months into Woodrow Wilson’s taking office, Wilson railed against tariffs, arguing that the existing regime represented “privileges and exemptions from competition behind which it was easy by any, even the crudest, forms of combination to organize monopoly.” Under mounting pressure from Democrats, Congress passed the Revenue Act of 1913, which lowered average tariff rates from about 40 percent to 25 percent and imposed a graduated income tax, beginning at 1 percent for incomes above $3,000 ($97,726 in 2025) and rising to 7 percent for incomes above $500,000 ($16.3 million).1 This 7 percent level very much represented a “class tax,” applicable to only 2 percent of the population. That law was designed to raise about three-quarters of a billion dollars for ordinary expenses, but in just a few years the government needed to drastically increase revenues.
1916–1920: Tax Brackets Multiply and Rates Rise During the War
With World War I looming, President Wilson recognized the need for increased defense spending and, consequently, more revenues. At the same time, Rep. Claude Kitchin (D-NC), who served as chairman of the House Ways and Means Committee, saw an opportunity to introduce progressive tax policy that would take on concentrated wealth and corruption. For the next century, these two principles would be the core of US tax policy, mostly as complements but occasionally as substitutes. These dual purposes helped pass the Revenue Act of 1916, which took the country from 7 tax brackets with a top rate of 7 percent on incomes over $500,000 ($14.8 million) to 14 brackets with a top rate of 15 percent on incomes over $2 million ($59.2 million).
By 1917, the new annual federal budget amounted to almost the combined federal budgets for every year between 1791 through 1916. But in the face of the war, President Wilson sought even higher revenues. In an effort to raise over $2.5 billion in revenues for the war alone, Wilson signed the War Revenue Act of 1917, ballooning the top tax rate to 67 percent. Then the Revenue Act of 1918 increased it further, to 77 percent. In a speech to a joint session of Congress in May 1918, President Wilson summed up his fiscal vision: “Our financial program must no more be left in doubt or suffered to lag more than our ordnance program or our ship program, or our munitions program or our program for making millions of men ready.” With soldiers sacrificing their lives, President Wilson felt that the rest of the American people would take on the tax burden “cheerfully and with a sort of solemn pride.”
In just a few years the country had gone from 7 brackets, the number we have today, and a top rate of 7 percent to 56 brackets with a top rate of 77 percent, which applied to incomes over $1 million ($21.4 million). Tax revenues quadrupled from 1917 to 1918, even as the income tax still only applied to 5 percent of the population.
1920–1932: Mellon Returns to Fewer Brackets and Lower Rates
After the war, Republicans got control of the White House and Congress in 1920 and ushered in a new era of tax policy. President Warren G. Harding’s secretary of the Treasury, Andrew Mellon, argued that with postwar budget surpluses, America’s economy needed lower tax rates to spur growth. Adopting the rhetoric of the populist movement, Mellon released a mass-market book called Taxation: The People’s Business to make the case that tax cuts would lead to both higher tax revenues and economic growth. The Revenue Act of 1921 slashed the top marginal rate down from 73 percent to 58 percent, applicable to incomes over $200,000 ($3.6 million). Next, the Revenue Act of 1924 further brought down the top rate to 46 percent and increased the applicable threshold to incomes over $500,000 ($9.4 million).
Then, continuing to serve under President Calvin Coolidge, Mellon culminated his push with the Revenue Act of 1926, which cut the number of tax brackets down from 43 to 23 and the top rate to 25 percent, applicable to incomes over $100,000 ($1.8 million). This individual income tax structure stayed in place until 1932, in the aftermath of the Great Depression. However, slashing the top rates and collapsing the number of brackets would come back into vogue, supercharged, decades later under President Ronald Reagan.
Figure 1
1932–1963: FDR’s Higher Rates Endure
On the back of a growing deficit wrought by a recession, President Herbert Hoover imposed the largest peacetime tax increase in American history with the Revenue Act of 1932. It more than doubled estate taxes and raised corporate tax rates, and brought individual income tax rates near wartime levels. That year the US tax code once again had over 50 tax brackets, now with a top rate of 63 percent applicable to incomes over $1 million ($23.6 million).
The next president would go further. At first, President Franklin D. Roosevelt hesitated to raise taxes beyond what Hoover did, but by 1934 he changed his tune, arguing that the tax code had “done little to prevent an unjust concentration of wealth and economic power.” To help fund stimulative New Deal programs, Roosevelt signed the Revenue Act of 1935, bringing the tax code back to World War I levels. The top rate shot up to 79 percent, applicable to the select few with incomes over $5 million ($117.3 million). Several years later, with a crisis on his hands, Roosevelt felt the need to raise rates even higher: During World War II, the top rate climbed to 94 percent. Even when the war ended, the era of high top rates was durable, unlike in the post–World War I Mellon years. Rates didn’t fall back to Mellon levels for almost 40 years.
Through 1963, the top tax rate remained at least 91 percent for incomes over $200,000 ($2.1 million). Presidents Harry S. Truman and Dwight D. Eisenhower fought to keep rates and revenues high in order to “combat inflation, repay the war debt, balance the budget, and cover the cost of Cold War conflicts,” according to researcher Tracey M. Roberts.
But in time, more policymakers began to see the income tax as a macroeconomic tool to spur growth rather than just a fiscal tool to balance budgets. Along those lines President John F. Kennedy pushed for tax cuts, only to see his efforts thwarted by congressional Democrats. After Kennedy’s assassination, President Lyndon B. Johnson was able to shepherd tax cuts through Congress, bringing the top rate down to 77 percent in 1964 and then 70 percent the year after. This individual income tax regime continued with only moderate changes through the Carter administration.
1981–2026: Reagan’s Tax Policy Becomes the New Norm
However, a period of stagflation mired the economy and set the stage for a new era of tax policy and politics. Until 1985, tax brackets were not indexed to inflation, so taxpayers suffered from “bracket creep.” For example, $100,000 in 1981 was equivalent to just $35,698 in 1966, though that income was taxed at 59 percent at the margin in 1981 and 42 percent in 1966. More and more taxpayers found themselves in the top bracket, and not because of higher real incomes. This helped lay the groundwork for President Ronald Reagan’s fundamental changes to the federal income tax, which ushered in a new and lasting era of tax policy in America.
This era began with the Economic Recovery Tax Act of 1981, which reduced the highest marginal tax rate from 70 percent to 50 percent. Later, while removing deductions to simplify the tax code and broaden the tax base, Reagan brought the top bracket down to incomes of $41,500 ($146,941). President Reagan then took a second, larger step through the Tax Reform Act of 1986: Due to this law, by 1990 there were just two tax brackets and a top rate of 28 percent applicable to incomes over $19,450 ($47,925), about 35 percent above median personal income that year.
The Reagan tax cuts marked a stark departure from much of the 20th century and changed the field of play for tax debates. Since the early 1990s, we have had a narrow range of tax rates (35 to 39.6 percent) and a small number of tax brackets (5 to 7). This paradigm has been remarkably entrenched, even as the range of fiscal and macroeconomic events has expanded dramatically: America’s debt as a percent of GDP has more than doubled since the 1990s, the country spent nearly 9 years in a war in Iraq and almost 20 in Afghanistan, and the economy faced the worst recession since the Great Depression.
Pushing incomes at the extremes of the spectrum into the same brackets as incomes closer to the center of the distribution is normal now, but a historical anomaly. In 2023, a single filer earning just over $550,000 a year in taxable income faced the same marginal tax rate as the 1,531 filers earning $78.6 million or more in adjusted gross income annually—despite making only 0.7 percent of their income. Contrast that to every year before 1967, when the top rate consistently kicked in at incomes at least over $1 million in today’s dollars, with some brackets so high that today’s top 0.001 percent of earners would not reach them. Inflation-driven bracket creep instigated the reforms that have now led to an era of bracket compression.
II. Why the US Needs More Progressive Income Tax Brackets
Throughout the course of American history, there have been ample economic, fiscal, and political reasons to adjust the individual income tax—like wars, recessions, and inflation, to name a few. Of course, these drastically different macroeconomic and geopolitical reasons are a powerful reminder that precedent should not determine policy today. But precedent is still useful context. Today, there are three main reasons that we should bring policy closer to historical norms and reintroduce more progressivity into the individual income tax.
Income Inequality
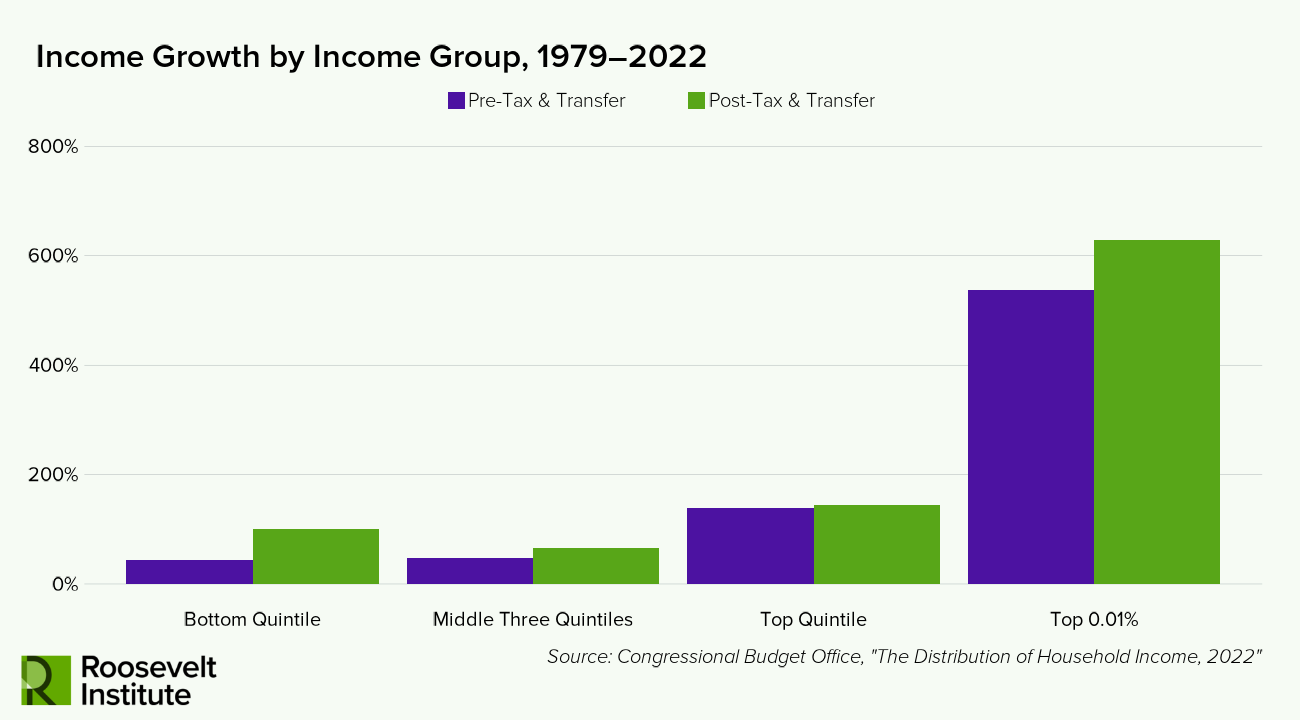
A primary reason to introduce greater structural flexibility into the income tax regime is to enable progressive taxation at a time of rampant, growing income inequality. From 1979 to 2022, the lowest quintile of earners saw their average income—before taxes and transfers—grow 44 percent, or at a tepid annual rate of 0.9 percent. It was a similar story for the middle three quintiles—47 percent growth. The top quintile, though, saw 138 percent growth. The very top 0.01 percent saw 537 percent growth.
Some progressivity is already enshrined in the tax code, supporting those in the middle and bottom of the income distribution. The middle three quintiles of earners saw their post-tax-and-transfer average incomes rise by 65 percent. With redistributive programs like the Child Tax Credit, the Earned Income Tax Credit, and the Supplemental Nutritional Assistance Program, the bottom quintile saw its average incomes rise by 100 percent—more than double its pre-tax-and-transfer rate.
However, the highest earners still came out on top over these years. That’s because the progressive elements of the tax code were overpowered by pre-tax-and-transfer income inequality, the drop in tax rates at high incomes, and the reshaping of the tax code to erase distinctions at the highest of high incomes. The highest quintile saw their post-tax-and-transfer income grow by 144 percent. For those in the top 0.01 percent, the decline in tax rates contributed to 628 percent growth in post-tax-and-transfer incomes.
Figure 2
Growing income inequality—coupled with wealth inequality—has significant consequences for the macroeconomy and for society. Rising levels of income inequality can constrain future economic growth. One study finds that the rise in income inequality from 1979 through 2018 reduced growth in aggregate demand by about 1.5 percent of GDP, because economy-wide spending drops when lower-income households have less to spend. Multiple scholars have found that income inequality causes democratic backsliding, as leaders stoke partisan polarization and the richest citizens have an outsize voice and influence in politics. Weakened campaign finance regulations have supercharged this dynamic.
Vertical Inequity
A second reason to consider more tax brackets and more progressivity relates to a very narrow slice of income inequality: There’s significant and growing income inequality even within the 1.1 million tax filers who were in the top tax bracket in 2023. From 1979 to 2022, the post-tax-and-transfer income for the very top 0.01 percent of American households grew 628 percent. That topped the rest of those in the top 0.1 percent, whose income grew 492 percent, which, in turn, dwarfed the rest of the top 1 percent, whose income grew 230 percent.
Historically, America’s tax code had more vertical equity: People with greater means faced higher tax burdens, even at the very top. The uber-rich paid a higher rate than the very rich, who paid a higher rate than the rich. For example, in 1918 there were 56 tax brackets, with the top rate of 77 percent applying to the small fraction of earners making about $21.5 million in today’s dollars. Then, the top marginal rate ranged from 60 percent to 77 percent for those making over $2 million in today’s dollars.
Today, the top rate is only 37 percent and applies to a much larger group. In that way, the income tax treats the last dollar earned by many surgeons and small business owners the same as that of Fortune 500 CEOs. (In fact, surgeons are usually taxed more than CEOs because surgery is labor and the tax code gives preferential treatment to capital income.) We can look at tax data from 2023 to parse this out: The top 1 percent of individual returns (about 1.5 million) all reported over $675,602 in income.2 The top 0.1 percent of filers made at least $3.1 million, the top 0.01 percent (about 15,000) made at least $16.0 million, and the top 0.001 percent all made at least $78.6 million. Yet these 1.5 million filers were nearly all in the same tax bracket. What’s more, looking at the average tax rate actually paid, in most cases the higher the income reported, the lower the average tax rate on that income. For instance, the top 1 percent of filers paid an average of 26.27 percent in taxes, while the top 0.001 percent paid 23.61 percent.
Table 1: 2023 Income Taxes for the Top 1%
| Income Group | Income Floor | Number of Filers | Average Tax Rate |
|---|---|---|---|
| Top 1% | $675,602 | 1,530,764 | 26.27% |
| Top 0.1% | $3,100,950 | 153,076 | 26.65% |
| Top 0.01% | $16,086,174 | 15,308 | 25.24% |
| Top 0.001% | $78,617,933 | 1,531 | 23.61% |
Rising Debt Burden
Lastly, more brackets will give policymakers more flexibility to tweak the tax code to adapt to different policy needs over time. And right now, more brackets with more progressivity can increase tax revenues at a time when our country’s fiscal situation demands it—in no small part because we’ve run up a tab to finance tax cuts for the wealthy.
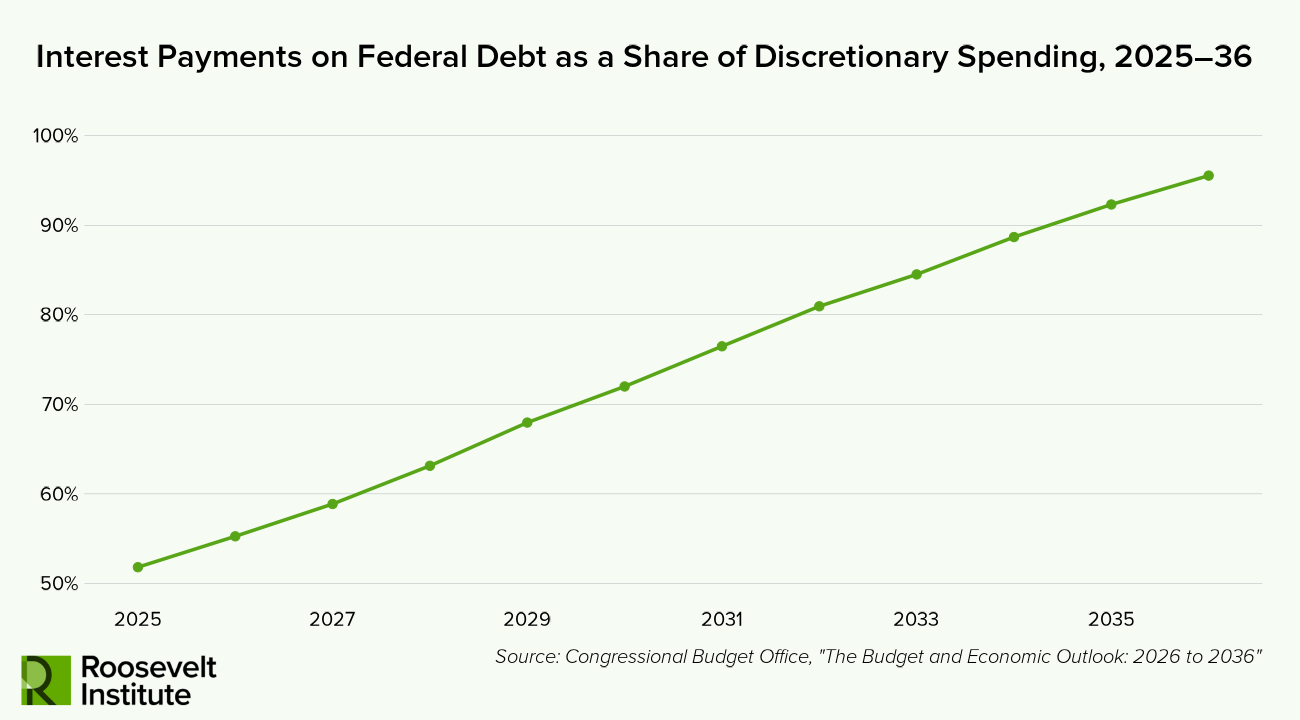
One warning sign that our fiscal situation is nearing a crisis point is the cost of servicing our debt. As inflation spiked during and after the COVID-19 pandemic and remains above the Federal Reserve’s target 2 percent rate, interest rates remain far above the near-zero lows of the previous 14 years after the 2008 financial crisis. It remains to be seen whether today’s rise is transitory or the start of a new equilibrium, but, regardless, Treasury debt issued today will cost the government more in payments to bondholders. With the debt level growing, the Congressional Budget Office (CBO) already forecasts that the net interest payments on our debt will double over the next 10 years—going from $1.0 trillion in 2025 to $2.1 trillion in 2036. In other words, net interest payments will amount to 4.6 percent of GDP in 2036, more than twice the 2.1 percent average of the prior 50 years. These payments will add up to more than the entire budget deficit of each year in our history, bar fiscal years 2020 and 2021 during the pandemic. Net interest payments will only continue to grow if interest rates stay at today’s levels. And as real interest rates approach or exceed the rate at which our economy grows, we cannot simply “grow our way” out of debt—the approach that has been central to past successful major debt reduction programs.
These conditions risk causing a spiral if investors get nervous about the US fiscal situation and demand higher and higher interest rates in order to purchase debt. What would that look like in the economy? The government would have less space to respond to crises as it did during the Great Recession and COVID-19, let alone proactively invest in education, healthcare, defense, or housing. Higher government borrowing could crowd out productive private investment, raising interest costs for families and businesses and slowing economic growth, which would make it even more challenging for the economy to grow its way out of the debt burden. In an especially worrying scenario, investors could lose confidence in the US dollar, sending borrowing costs even higher and eliminating the benefits the American economy enjoys from issuing the world’s main reserve currency.
Another warning sign is the country’s debt-to-GDP ratio, which conveys a country’s ability to pay back its debt by the size of its economy. Economists often use this measure to gauge debt sustainability. A higher ratio raises the likelihood of a fiscal crisis, where bondholders refuse to finance further borrowing because they have lost faith that the federal government is a trustworthy lender. Last year, the CBO projected that by the end of 2025 this ratio would climb up to 99.9 percent, more than double the average of the prior 50 years. While our debt burden is high by international comparisons, the level in itself is not a five-alarm fire. Historic permanent demand for the dollar has enabled America to borrow at cheap rates, with US Treasury debt viewed as one of the safest, most useful, most liquid assets in the world. However, the runaway projected growth of the debt-to-GDP ratio is cause for alarm.
In the aforementioned projection, the CBO estimated that the debt-to-GDP ratio would climb to 117 percent by 2034 and 154 percent by 2054. Then President Trump signed the so-called One Big Beautiful Bill Act (OBBBA) into law, which will add $4.2 trillion to the national debt by 2034 and shoot the forecasted debt-to-GDP ratio that year up nine percentage points to 126 percent. The situation may look even bleaker in 30 years, at which point Alan Auerbach and William Gale calculate a ratio of 183 percent while the Yale Budget Lab calculates 194 percent. And both of those estimates assume that Congress does not extend expensive and popular temporary measures of the OBBBA, like the elimination of taxes on tips and overtime and increases in the State and Local Tax (SALT) deduction.
Figure 3
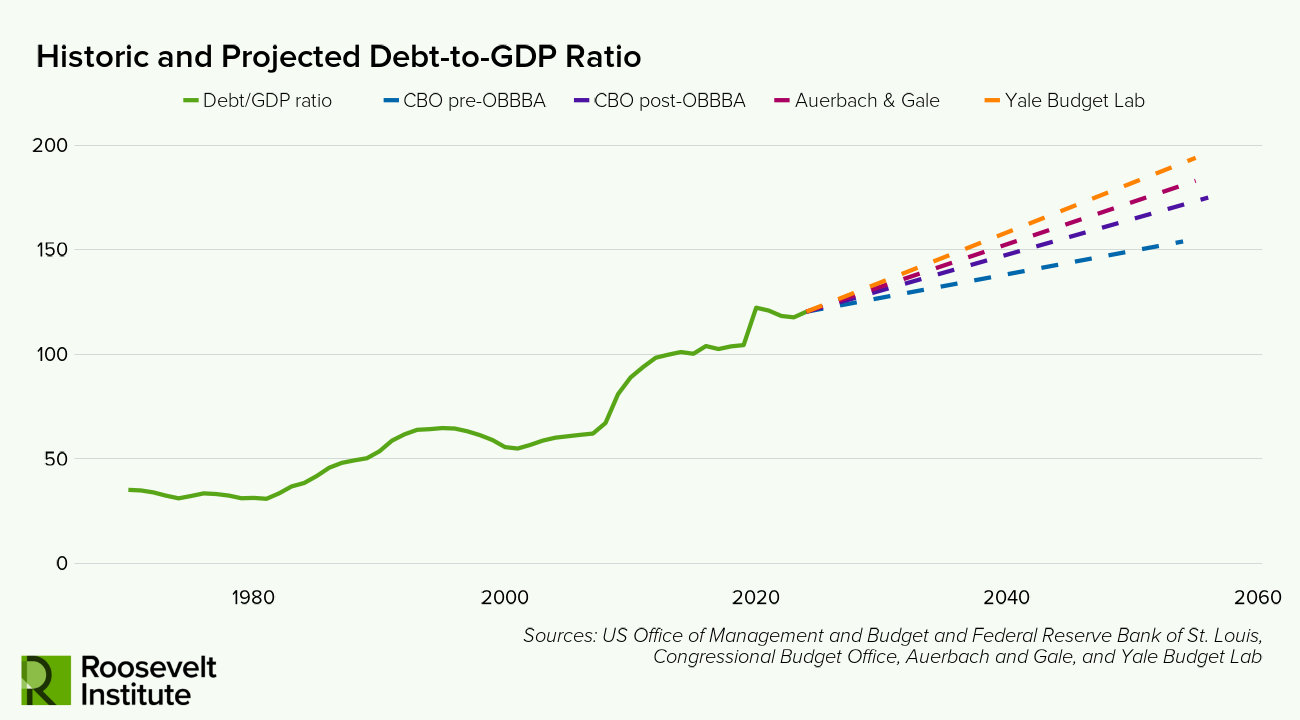
Neither the recent spike in interest rates nor the OBBBA started the fire, but they’re both adding fuel now. In fact, we don’t need a verse-length list of reasons to know how we got into this situation. There’s one primary reason for the high debt ratio: tax cuts. And we know what will make the situation even worse going forward: higher interest payments. This means the cost of delaying fiscal reform is higher every year.
In 2001, the debt-to-GDP ratio was 31.5 percent after falling from 48 percent over the course of the Clinton presidency, which delivered higher top-end marginal tax rates, a balanced budget, and a fiscal path toward a stable debt-to-GDP ratio. Then America began binging on tax cuts, especially for the wealthy, without paying for them—relying instead on deficit financing to continue to pay for spending commitments as the “war on terror” consumed the peace dividend these tax cuts assumed. While the top tax rate on individual income only changed by a few percentage points, the richest Americans benefited immensely from lower rates across tax brackets and other tax cuts, including to capital gains, corporate rates, and more. And these tax cuts became more expensive as income inequality rose in tandem. The Bush and Trump tax cuts added $10 trillion to the national debt and accounted for 57 percent of the rise in the debt-to-GDP ratio. If you strip out onetime fiscal stimulus spending related to COVID-19 and the Great Recession, that number climbs even higher, to 90 percent.
The OBBBA continues this pattern, but with higher interest rates; it is much more irresponsible than the earlier poor policy choices it’s easily lumped in with. The positive effects are as illusory as ever, but because of higher interest rates, the rise in debt-servicing costs is much more severe than for the Bush tax cuts or the tax cuts from Trump’s first administration. The federal funds rate—the rate that banks lend to each other overnight and the benchmark interest rate for the US economy—remained below 2 percent for the decade after the 2008 financial crisis. Indeed, until mid-2017, it was below 1 percent. But as the Federal Reserve increased interest rates in response to postpandemic inflation, the federal funds rate climbed to over 5 percent in 2024, and the CBO now projects it will be at or above 3.4 percent through the next decade.
As previously detailed, with an accumulating debt and interest rates climbing from their post-financial-crisis near-zero levels, the amount the government spends just paying interest on the debt is expected to more than double to $2.1 trillion by 2036. For comparison, that is more than all of discretionary spending in 2025, which includes outlays for defense, transportation, education, homeland security, national parks, and more. It approaches spending levels for both Social Security and Medicare. It is more than the federal deficit has ever been in any year outside of the pandemic.
Figure 4
These repeated tax cuts—coupled with long-forecasted increases in Medicare and Social Security spending driven by an aging population and unexpected increases in interest rates—have put the United States in a precarious fiscal position to pay off its debt, let alone make the needed investments in education, energy, childcare, housing, and healthcare that grow the economy and make debts easier to pay off.
III. Reversing Reaganism: What a 14-Bracket Federal Income Tax Could Look Like
As policymakers consider tax reform, they should prioritize the structural reform of bringing back more tax brackets and using that structure to introduce greater progressivity into the tax code. Beyond the three reasons discussed earlier, returning tax brackets to their historical norm would also align with modern empirical evidence that trickle-down, supply-side tax policy has failed to deliver economic growth or opportunity.
New Tax Bracket Proposals
So what could this new structure look like, and how would it compare to today’s? To start, Table 2 shows the seven tax brackets applicable to income earned in 2025.
Table 2: 2025 Tax Rates
| Rate | Single Filer | Joint Filers |
| 10% | $0 | $0 |
| 12% | $11,925 | $23,850 |
| 22% | $48,475 | $96,950 |
| 24% | $103,350 | $206,700 |
| 32% | $197,300 | $394,600 |
| 35% | $250,525 | $501,050 |
| 37% | $626,351 | $751,600 |
One way to increase the number of tax brackets is to resurrect a tax structure more aligned with historic norms. To start, we can double the number of tax brackets from 7 to 14. This would hardly be radical; that’s how many brackets existed during the early years of the Reagan administration as well as how many brackets existed in 1916, when President Wilson first began raising rates. It’s only half as many as the US had for most of the postwar boom.
Tax legislation is invariably a negotiation, and as bargaining proceeds, progressivity can easily become an abstraction relative to more concrete asks on total revenue and specific provisions. For an illustrative example of what the top marginal schedule could be with new brackets, we can again look to historic examples. In the early years of the Reagan administration, the top marginal tax rate was 50 percent, and in the decade before, the top marginal tax rate was 70 percent. This approaches what Professors Thomas Piketty, Emmanuel Saez, and Stefanie Stantcheva estimate is the revenue-maximizing top tax rate and follows the policy proposal Rep. Alexandra Ocasio-Cortez (D-NY) floated. Tables 3 and 4 show two cases for how to double from 7 to 14 tax brackets—namely, by introducing more rates at the upper end of the tax schedule.
Table 3: Seven New Brackets with Top Rate of 50%
| Rate | Income Threshold for Single Filer |
|---|---|
| 38% | $900,000 |
| 40% | $1.4 million |
| 42% | $2 million |
| 44% | $3 million |
| 46% | $4.5 million |
| 48% | $6.8 million |
| 50% | $10 million |
Table 4: Seven New Brackets with Top Rate of 70%
| Rate | Income Threshold for Single Filer |
|---|---|
| 40% | $900,000 |
| 43% | $1.4 million |
| 46% | $2 million |
| 50% | $3 million |
| 55% | $4.5 million |
| 62% | $6.8 million |
| 70% | $10 million |
Policymakers have a number of trade-offs to consider when setting up additional brackets.
First, we must consider the pace of the rate increases, which corresponds to the number of new brackets. In the 1920s, marginal tax rates went up by a percentage point at each new bracket, which can help minimize economic distortions by avoiding sharp increases. The solution at the time was to introduce dozens more tax brackets. In the schedule in Table 3 we suggest raising marginal rates by 2 percentage points as a realistic solution to achieving higher marginal rates without introducing dramatically more tax brackets than the status quo.
Alternatively, and more aligned with recent tax research, rates can rise quadratically, both mirroring the growing disparities at the top end of the income distribution and following research into optimal tax policy, which suggests that marginal rate schedules should steepen at the top end of the income distribution.
Second, we must consider income thresholds, including both the pace at which they should increase and what the top income tax bracket should be. The last time the United States had 14 brackets, in the early 1980s, the top marginal tax rate was 50 percent and applied to single filers making less than $200,000 in today’s dollars. On the other hand, in the late 1930s the top marginal tax rate was 79 percent and applied to incomes exceeding $100 million in today’s dollars, making the top bracket something to which only a small sliver of the population belonged.
These design decisions should be predicated on prioritizing and balancing policy goals, such as compressing post-tax-and-transfer inequality, maximizing revenue, minimizing economic distortions, or focusing on long-term stability versus shorter-term disruption.
While these policy options focus on the top end of incomes, the flexibility of more tax brackets can be useful across the income distribution. For example, President Joe Biden had pledged not to raise taxes on families making under $400,000—a pledge that covered about 97 percent of households. But as Professor David Kamin notes, “Maintaining and strengthening a progressive fiscal system will likely require raising revenue beyond the top.” In a way, President Trump has done that with tariffs, which raise taxes across the income distribution. But another more targeted, progressive, and efficient way for policymakers to consider taxation at incomes under $400,000 would be to use more brackets. This would give them greater flexibility and could benefit many of the families this pledge reassured.
Refuting Arguments Against Tax Code Change
More brackets don’t add complexity.
On its face, this increase in the number of brackets sounds complex and complicated. Indeed, that’s why in a 1985 address to the nation arguing for greater simplicity in the tax code, President Reagan cited the 14 different tax brackets as a cause of complexity—ironically, the year after TurboTax launched to deal with tax complexity that existing spreadsheets couldn’t manage. And here I am calling to return to 14 brackets. But any argument that more tax brackets would be a leading cause of tax complexity today would be a red herring. Today, figuring out a tax burden just based on tax brackets is the simplest part of filing taxes—it’s arithmetic that anyone can calculate in a minute with a table.
Let’s be clear on what causes tax filing to be complex—the laws on the books, not math.
What has created complexity in the tax system is the growth in tax expenditures, including exclusions, exemptions, deductions, and credits. The main mechanical headache for families isn’t figuring out what they owe using a standard deduction and the income tax rates; it’s sorting through eligibility rules for the SALT deduction, the mortgage interest deduction, the Earned Income Tax Credit, the Child Tax Credit, the Qualified Business Income deduction, the overtime and tips deductions, the senior deduction, the auto loan interest deduction, retirement contribution deductions, Health Savings Account deductions, and dozens and dozens more. Let’s be clear on what causes tax filing to be complex—the laws on the books, not math.
There are ways to avoid income shifting due to higher rates.
For decades, the richest taxpayers have been shifting their income away from ordinary income in order to avoid the top marginal tax rate on ordinary income. For example, from 1980 to 2022, wages and salary accounted for a decreasing share of the income of the top 1 percent, down from 34 percent to 27 percent. Passthrough business income doubled its share, now making up about a quarter of income for the top 1 percent. It is reasonable to assume that a higher top marginal tax rate on individual income would heighten the incentive for the rich to shift even more income toward sources with preferential rates, like capital.
That’s why it would be unwise to pursue higher individual income tax rates in isolation. While not the focus of this piece, addressing the discrepancies between tax rates on different sources of income is a long-standing tax reform issue. For example, a comprehensive tax package could include graduated tax rates on corporate income and capital gains, and closing loopholes and exceptions on other bases of income. Otherwise, we risk higher rates only applying to a narrow subset of people with high salaries, such as professional athletes, instead of all of those with high incomes.
More progressivity doesn’t deter economic growth.
Another common critique of increased progressivity in the tax code is that higher taxes at the top end would lower economic growth. However, in the postwar years there’s been no obvious relationship between top tax rates and economic growth. Most recently, we can look at the 2017 Trump tax cuts: The law did not accelerate GDP growth, consumer spending slowed, and business investment fell (similar results hold for the Bush tax cuts). Still, some argue that higher rates would stifle growth.
One potential reason is that workers, entrepreneurs, and companies would try to leave the country in search of lower-tax jurisdictions. That argument is weakened by empirical findings suggesting that physical tax flight is overstated, and even more so by the fact that US taxes are low relative to peer countries where tax flight might go. Total US taxes accounted for about 26 percent of GDP in 2024, well below the Organisation of Economic Co-operation and Development (OECD) average of 34 percent and below all but 7 of 38 countries. Further, Americans are taxed as US citizens worldwide and could face exit taxes if they renounce citizenship.
Another common argument is that higher rates would disincentivize entrepreneurship and work. But research shows that the elasticity of labor is fairly small and that much of the wealthiest people’s response to tax increases is tax avoidance and income shifting rather than an abandonment of economic participation.
Meanwhile, a more regressive tax code breeds greater post-tax income inequality, which in itself can limit economic growth. On the other hand, with increased tax revenues the government can pay down its debt and invest in things like education, infrastructure, and research funding that would increase productivity and growth—rather than paying interest on tax cuts for the wealthy. As just one example, Federal Reserve Governor Lisa Cook estimates that eliminating gender and racial disparities in access to opportunities in innovation could increase GDP per capita by 0.6 to 4.4 percent. Investing in creating more opportunities for these underrepresented groups could pay big dividends for national growth.
The number of [tax] brackets is not the cause of complexity; instead, it is the slew of deductions, credits, and their corresponding eligibility requirements that makes the tax filing process a labyrinth. Indeed, changing the number of brackets we have might be one of the simplest reforms there is.
IV. Conclusion: More Tax Brackets Would Give Policymakers More Flexibility
Most tax policy proposals rightly focus on numbers: rates, revenues, credits, deductions. These are all important parameters to consider. Yet they only make tweaks around the edges of the existing individual income tax system. Given the competing goals of tax policy, policymakers should consider what broader structural changes in the tax code are suited for our current and future fiscal and economic conditions.
Increasing the number of tax brackets is a structural change that would give policymakers the flexibility to accomplish a number of goals, including those mentioned in this brief. And in addition to aiding policymakers, such flexibility would not frustrate taxpayers. The number of brackets is not the cause of complexity; instead, it is the slew of deductions, credits, and their corresponding eligibility requirements that makes the tax filing process a labyrinth. Indeed, changing the number of brackets we have might be one of the simplest reforms there is.
Footnotes
- Throughout this section, income thresholds are for single filers. Parentheticals compare the values of dollars in the past to dollars in 2025 using the Consumer Price Index (CPI) through 1977 and the CPI for All Urban Consumers (CPI-U) after 1977. ↩︎
- By definition this is adjusted gross income (AGI), which includes wages, net capital gains, interest dividends, business incomes, taxable retirement distributions, and more. AGI is measured before subtracting deductions, so taxable income is lower. The top 1 percent here excludes returns filed by dependents. ↩︎
Appendix: Historical Tax Schedules Adjusted for Inflation
| Year | Number of Brackets | Top Marginal Rate | Top Income Bracket (Single Filers) | Top Income Bracket Single Filers (2025 $) | Top Income Bracket (Joint Filers) | Top Income Bracket Joint Filers (2025 $) |
| 2025 | 7 | 37.00% | $626,350 | $626,350 | $751,600 | $751,600 |
| 2024 | 7 | 37.00% | $609,350 | $625,384 | $731,200 | $750,440 |
| 2023 | 7 | 37.00% | $578,125 | $610,837 | $693,750 | $733,005 |
| 2022 | 7 | 37.00% | $539,900 | $593,932 | $647,850 | $712,685 |
| 2021 | 7 | 37.00% | $523,600 | $622,096 | $628,301 | $746,493 |
| 2020 | 7 | 37.00% | $518,400 | $644,854 | $622,050 | $773,787 |
| 2019 | 7 | 37.00% | $510,300 | $642,609 | $612,350 | $771,118 |
| 2018 | 7 | 37.00% | $500,000 | $641,047 | $600,000 | $769,257 |
| 2017 | 7 | 39.60% | $418,400 | $549,531 | $470,700 | $618,222 |
| 2016 | 7 | 39.60% | $415,050 | $556,744 | $466,950 | $626,362 |
| 2015 | 7 | 39.60% | $413,201 | $561,256 | $464,851 | $631,413 |
| 2014 | 7 | 39.60% | $406,751 | $553,151 | $457,601 | $622,303 |
| 2013 | 7 | 39.60% | $400,000 | $552,794 | $450,000 | $621,893 |
| 2012 | 6 | 35.00% | $388,350 | $544,555 | $388,350 | $544,555 |
| 2011 | 6 | 35.00% | $379,150 | $542,657 | $379,150 | $542,657 |
| 2010 | 6 | 35.00% | $373,650 | $551,666 | $373,650 | $551,666 |
| 2009 | 6 | 35.00% | $372,950 | $559,664 | $372,950 | $559,664 |
| 2008 | 6 | 35.00% | $357,700 | $534,870 | $357,700 | $534,870 |
| 2007 | 6 | 35.00% | $349,700 | $542,984 | $349,700 | $542,984 |
| 2006 | 6 | 35.00% | $336,550 | $537,471 | $336,550 | $537,471 |
| 2005 | 6 | 35.00% | $326,450 | $538,160 | $326,450 | $538,160 |
| 2004 | 6 | 35.00% | $319,100 | $543,892 | $319,100 | $543,892 |
| 2003 | 6 | 35.00% | $311,950 | $545,940 | $311,950 | $545,940 |
| 2002 | 6 | 38.60% | $307,050 | $549,563 | $307,050 | $549,563 |
| 2001 | 5 | 39.10% | $297,350 | $540,641 | $297,350 | $540,641 |
| 2000 | 5 | 39.60% | $288,350 | $539,096 | $288,350 | $539,096 |
| 1999 | 5 | 39.60% | $283,150 | $547,250 | $283,150 | $547,250 |
| 1998 | 5 | 39.60% | $278,450 | $549,943 | $278,450 | $549,943 |
| 1997 | 5 | 39.60% | $271,050 | $543,635 | $271,050 | $543,635 |
| 1996 | 5 | 39.60% | $263,750 | $541,361 | $263,750 | $541,361 |
| 1995 | 5 | 39.60% | $256,500 | $541,913 | $256,500 | $541,913 |
| 1994 | 5 | 39.60% | $250,000 | $542,997 | $250,000 | $542,997 |
| 1993 | 5 | 39.60% | $250,000 | $557,157 | $250,000 | $557,157 |
| 1992 | 3 | 31.00% | $51,900 | $119,079 | $86,500 | $198,465 |
| 1991 | 3 | 31.00% | $49,300 | $116,540 | $82,150 | $194,194 |
| 1990 | 2 | 28.00% | $19,450 | $47,925 | $32,450 | $79,957 |
| 1989 | 2 | 28.00% | $18,550 | $48,174 | $30,950 | $80,377 |
| 1988 | 2 | 28.00% | $17,850 | $48,594 | $29,750 | $80,991 |
| 1987 | 5 | 38.50% | $54,000 | $153,003 | $90,000 | $255,004 |
| 1986 | 16 | 50.00% | $88,270 | $259,269 | $175,250 | $514,748 |
| 1985 | 16 | 50.00% | $85,130 | $254,790 | $169,020 | $505,869 |
| 1984 | 16 | 50.00% | $81,800 | $253,506 | $162,400 | $503,293 |
| 1983 | 14 | 50.00% | $55,300 | $178,749 | $109,400 | $353,620 |
| 1982 | 14 | 50.00% | $41,500 | $138,452 | $85,600 | $285,578 |
| 1981 | 17 | 70.00% | $108,300 | $383,464 | $215,400 | $762,678 |
| 1980 | 17 | 70.00% | $108,300 | $423,095 | $215,400 | $841,502 |
| 1979 | 17 | 70.00% | $108,300 | $480,419 | $215,400 | $955,515 |
| 1978 | 26 | 70.00% | $102,200 | $504,385 | $203,200 | $1,002,849 |
| 1977 | 26 | 70.00% | $102,200 | $542,875 | $203,200 | $1,079,376 |
| 1976 | 25 | 70.00% | $100,000 | $565,725 | $200,000 | $1,131,451 |
| 1975 | 25 | 70.00% | $100,000 | $598,218 | $200,000 | $1,196,436 |
| 1974 | 25 | 70.00% | $100,000 | $652,922 | $200,000 | $1,305,845 |
| 1973 | 25 | 70.00% | $100,000 | $725,097 | $200,000 | $1,450,194 |
| 1972 | 25 | 70.00% | $100,000 | $769,885 | $200,000 | $1,539,771 |
| 1971 | 25 | 70.00% | $100,000 | $795,078 | $200,000 | $1,590,156 |
| 1970 | 25 | 70.00% | $100,000 | $829,216 | $200,000 | $1,658,431 |
| 1969 | 25 | 70.00% | $100,000 | $877,635 | $200,000 | $1,755,271 |
| 1968 | 25 | 70.00% | $100,000 | $925,576 | $200,000 | $1,851,151 |
| 1967 | 25 | 70.00% | $100,000 | $965,115 | $200,000 | $1,930,230 |
| 1966 | 25 | 70.00% | $100,000 | $991,876 | $200,000 | $1,983,751 |
| 1965 | 25 | 70.00% | $100,000 | $1,021,782 | $200,000 | $2,043,564 |
| 1964 | 26 | 77.00% | $200,000 | $2,075,913 | $400,000 | $4,151,826 |
| 1963 | 24 | 91.00% | $200,000 | $2,102,485 | $400,000 | $4,204,970 |
| 1962 | 24 | 91.00% | $200,000 | $2,128,549 | $400,000 | $4,257,098 |
| 1961 | 24 | 91.00% | $200,000 | $2,154,041 | $400,000 | $4,308,082 |
| 1960 | 24 | 91.00% | $200,000 | $2,177,129 | $400,000 | $4,354,259 |
| 1959 | 24 | 91.00% | $200,000 | $2,208,871 | $400,000 | $4,417,743 |
| 1958 | 24 | 91.00% | $200,000 | $2,231,222 | $400,000 | $4,462,444 |
| 1957 | 24 | 91.00% | $200,000 | $2,292,062 | $400,000 | $4,584,124 |
| 1956 | 24 | 91.00% | $200,000 | $2,368,708 | $400,000 | $4,737,417 |
| 1955 | 24 | 91.00% | $200,000 | $2,404,803 | $400,000 | $4,809,606 |
| 1954 | 24 | 91.00% | $200,000 | $2,398,086 | $400,000 | $4,796,171 |
| 1953 | 24 | 92.00% | $200,000 | $2,405,522 | $400,000 | $4,811,043 |
| 1952 | 24 | 92.00% | $200,000 | $2,425,183 | $400,000 | $4,850,365 |
| 1951 | 24 | 91.00% | $200,000 | $2,480,492 | $400,000 | $4,960,983 |
| 1950 | 24 | 91.00% | $200,000 | $2,675,390 | $400,000 | $5,350,779 |
| 1949 | 24 | 91.00% | $200,000 | $2,704,494 | $400,000 | $5,408,989 |
| 1948 | 24 | 91.00% | $200,000 | $2,678,172 | $200,000 | $2,678,172 |
| 1947 | 24 | 91.00% | $200,000 | $2,884,148 | $200,000 | $2,884,148 |
| 1946 | 24 | 91.00% | $200,000 | $3,299,103 | $200,000 | $3,299,103 |
| 1945 | 24 | 94.00% | $200,000 | $3,578,735 | $200,000 | $3,578,735 |
| 1944 | 24 | 94.00% | $200,000 | $3,660,107 | $200,000 | $3,660,107 |
| 1943 | 24 | 88.00% | $200,000 | $3,720,164 | $200,000 | $3,720,164 |
| 1942 | 24 | 88.00% | $200,000 | $3,942,240 | $200,000 | $3,942,240 |
| 1941 | 32 | 81.00% | $5,000,000 | $109,318,506 | $5,000,000 | $109,318,506 |
| 1940 | 33 | 79.00% | $5,000,000 | $114,913,978 | $5,000,000 | $114,913,978 |
| 1939 | 33 | 79.00% | $5,000,000 | $115,740,221 | $5,000,000 | $115,740,221 |
| 1938 | 33 | 79.00% | $5,000,000 | $114,228,995 | $5,000,000 | $114,228,995 |
| 1937 | 33 | 79.00% | $5,000,000 | $111,917,889 | $5,000,000 | $111,917,889 |
| 1936 | 33 | 79.00% | $5,000,000 | $116,082,426 | $5,000,000 | $116,082,426 |
| 1935 | 30 | 63.00% | $1,000,000 | $23,456,685 | $1,000,000 | $23,456,685 |
| 1934 | 30 | 63.00% | $1,000,000 | $24,056,116 | $1,000,000 | $24,056,116 |
| 1933 | 55 | 63.00% | $1,000,000 | $24,893,142 | $1,000,000 | $24,893,142 |
| 1932 | 55 | 63.00% | $1,000,000 | $23,599,399 | $1,000,000 | $23,599,399 |
| 1931 | 23 | 25.00% | $100,000 | $2,116,932 | $100,000 | $2,116,932 |
| 1930 | 23 | 25.00% | $100,000 | $1,927,802 | $100,000 | $1,927,802 |
| 1929 | 23 | 25.00% | $100,000 | $1,876,343 | $100,000 | $1,876,343 |
| 1928 | 23 | 25.00% | $100,000 | $1,876,343 | $100,000 | $1,876,343 |
| 1927 | 23 | 25.00% | $100,000 | $1,854,724 | $100,000 | $1,854,724 |
| 1926 | 23 | 25.00% | $100,000 | $1,818,887 | $100,000 | $1,818,887 |
| 1925 | 23 | 25.00% | $100,000 | $1,835,270 | $100,000 | $1,835,270 |
| 1924 | 43 | 46.00% | $500,000 | $9,399,796 | $500,000 | $9,399,796 |
| 1923 | 50 | 58.00% | $200,000 | $3,776,457 | $200,000 | $3,776,457 |
| 1922 | 50 | 58.00% | $200,000 | $3,844,096 | $200,000 | $3,844,096 |
| 1921 | 56 | 73.00% | $1,000,000 | $18,036,022 | $1,000,000 | $18,036,022 |
| 1920 | 56 | 73.00% | $1,000,000 | $16,063,417 | $1,000,000 | $16,063,417 |
| 1919 | 56 | 73.00% | $1,000,000 | $18,573,992 | $1,000,000 | $18,573,992 |
| 1918 | 56 | 77.00% | $1,000,000 | $21,402,938 | $1,000,000 | $21,402,938 |
| 1917 | 21 | 67.00% | $2,000,000 | $50,205,536 | $2,000,000 | $50,205,536 |
| 1916 | 14 | 15.00% | $2,000,000 | $59,164,385 | $2,000,000 | $59,164,385 |
| 1915 | 7 | 7.00% | $500,000 | $15,925,158 | $500,000 | $15,925,158 |
| 1914 | 7 | 7.00% | $500,000 | $16,069,831 | $500,000 | $16,069,831 |
| 1913 | 7 | 7.00% | $500,000 | $16,287,716 | $500,000 | $16,287,716 |
Acknowledgments
The author would like to thank Emily Caputo, Harris Eppsteiner, Corey Husak, Bobby Kogan, Mike Madowitz, Hannah Groch-Begley, Toyosi Odusola, Katherine De Chant, and Julie Hersh for their thoughtful comments, critiques, and contributions to this paper. Any errors, omissions, or other inaccuracies are the author’s alone.
Suggested Citation
Gupta, Samarth. 2026. “Reaganism Broke US Tax Brackets. It’s Time To Fix Them.” Roosevelt Institute, September 15.
RELATED RESOURCES
Author