Strait Talk: Knock-on Effects from the Energy Shock Could Show Up in This Month’s Jobs and Inflation Data
March 27, 2026
By Michael Madowitz
Ripples from the energy shock will show up in the next Producer Price data, and could impact consumer prices and job market data.
It’s probably too soon for the energy shock stemming from the war in Iran to show up fully in the job market. But the economy was already flashing warning signs before that shock hit: Through February, it had averaged almost no net job creation over the previous six months. That leaves this month’s jobs report exposed to significant downside risk, which could show up next week in three ways.
First, expectations are high for March data—last month’s numbers were weakened by a health-care strike and concerns over bad weather (though the San Francisco Fed data says last month was even worse when adjusted for weather). Weekly unemployment insurance claims data have been (slightly) stronger than over the last year, so some snapback growth is expected this month. Hopefully this sets up stronger job growth in March, but if job numbers fall short of elevated expectations, it will make news, and not in a good way.
Second, temp jobs resumed their downward trend last month after having stabilized since October—a canary in the coal mine for the broader job market, where shifts in business activity tend to show up first. Further weakening in temp jobs could signal a general slowdown in the job market or be the first sign of uncertainty about the energy shock spreading to the job market.
Finally, the household data offered a counter to job market doomsayers last month and has, in aggregate, held up much better than the payroll survey would suggest. The broadest unemployment measure fell again last month, and top-line figures were little changed. However, if household data weakens substantially this month, it would not only reinforce concerns raised by last month’s weak payroll data but also fit a pattern common early in recessions, when household data trail payroll data in weakening. Despite these risks, expectations are for a healthy jobs report, and hopefully forecasters are right so we can rest easy about the job market . . . and immediately start worrying about the inflation data coming next!
To state the obvious, inflation data will be arriving late to the party by the time it publishes in April. We’ve all already seen energy costs rise as a result of the war with Iran. Normally this would lead to questions about how soon and where to look for the effects in inflation data, but we already know that energy was the main counterweight to high overall inflation before the war.
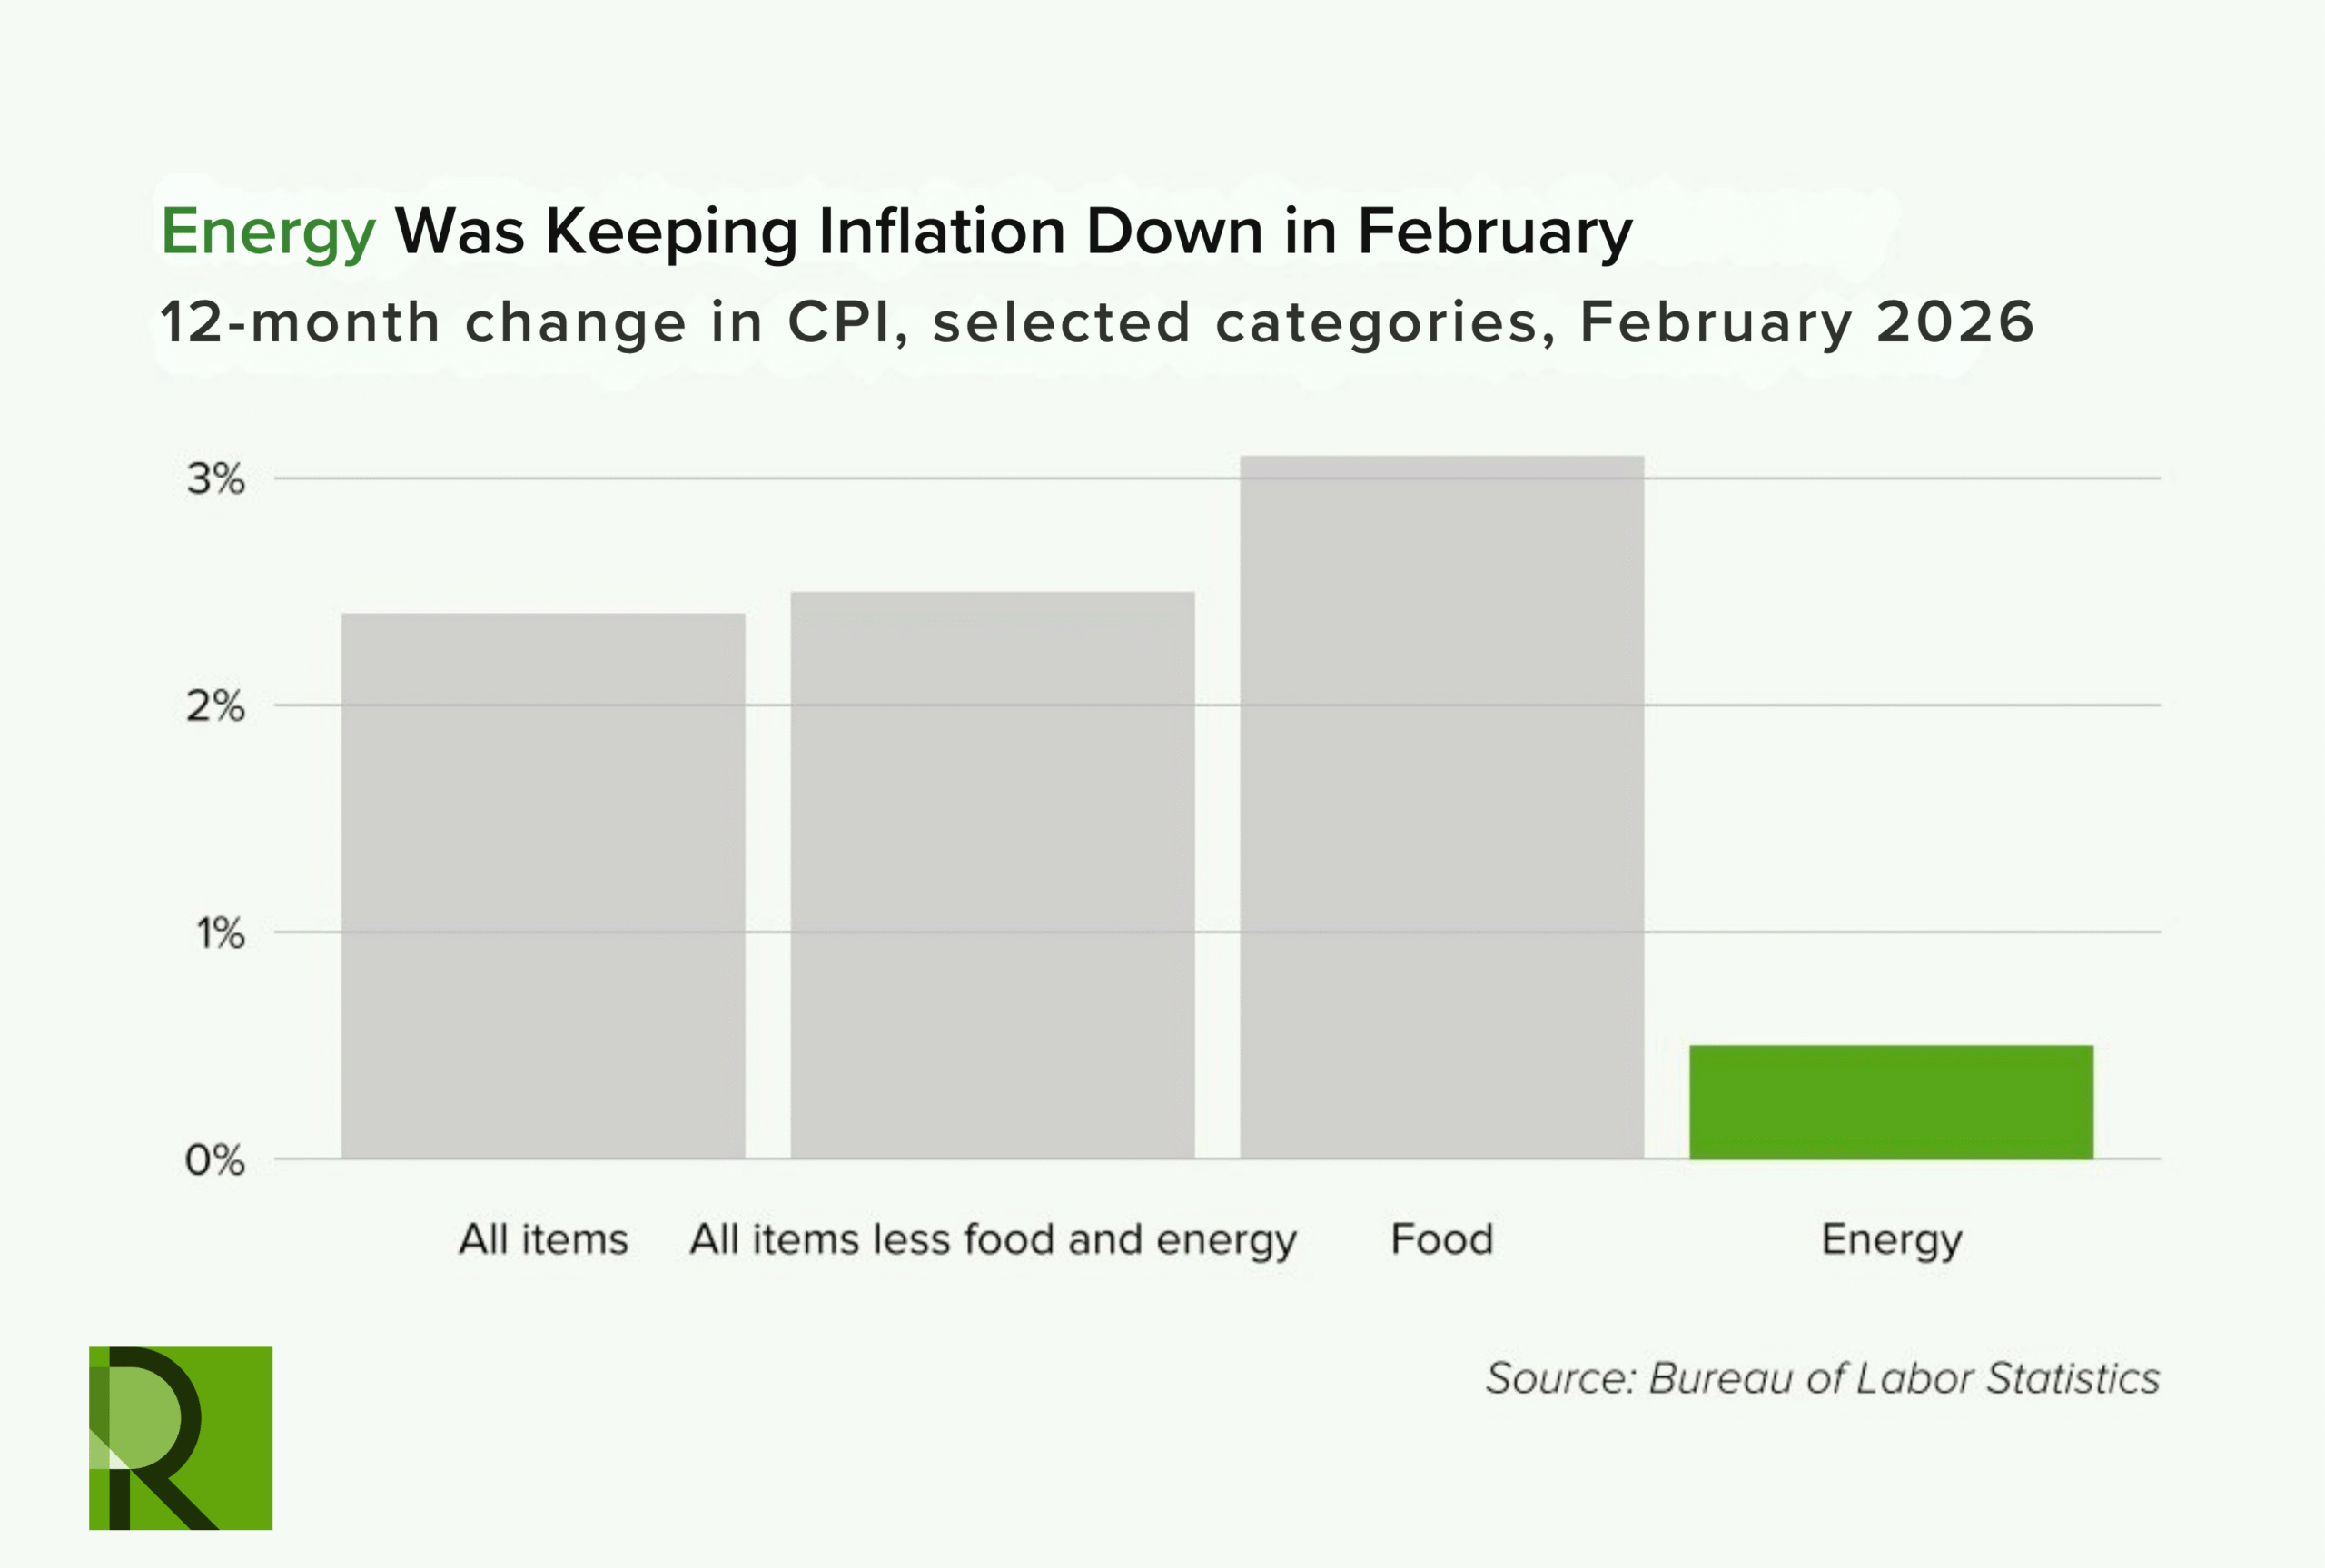
This is despite some energy-intense goods leading the pack in inflation over the last year—natural gas service was up more than 10 percent for the year, and airfares were up over 7 percent. But gasoline’s outsized role in household budgets pulled in the other direction—among major Consumer Price Index (CPI) categories, it posted the largest price decline over the year, falling 5.6 percent.
Rarely has it been easier to predict the abrupt end of a trend. As of this writing, gas prices are up 33 percent in a month, and national diesel prices are up 43 percent. The US has dodged the global natural gas shock, but the ongoing war has most impacted prices for energy used to transport goods, with diesel, jet fuel, and bunker fuel oil used by ships seeing the largest price increases.
Beyond the energy households use and the obvious effects on transportation, the April 10 CPI and April 14 Producer Price Index (PPI) data will be unusually closely watched for signs of energy costs spreading to other industries. As a baseline, the Integrated Industry-Level Production Account (KLEMS) gives some indication of the role energy plays in industry costs. The industries that have energy compensation costs that exceed the private-sector average of 1.7 percent of gross output include predictable ones, like air transportation (17 percent), and surprises like food services (2.6 percent). Producer inflation is more volatile than consumer inflation, and these price shocks are frequently absorbed by businesses. But after accelerating three straight months, and given that one-third of last month’s intermediate processed goods inflation came from diesel prices alone, cost increases in PPI may better predict household inflation than usual.
In other words, the next inflation reports will tell us whether this is still mainly an energy story—or if we’re already at the start of something broader.
Author