The Economy Doesn’t Have the Room to Absorb This Oil Shock
March 19, 2026
By Michael Madowitz
This week, the Fed left interest rates untouched, partly because the economy is worse than we thought it was six weeks ago. (Also, the Trump administration started a war in the Middle East, so that’s probably not helping.) While I wouldn’t broadly panic too much right now, some alarm from energy markets is warranted and could be constructive given the large and growing energy supply shocks from the attacks on the region. With the job market already anemic, growth slow, and inflation risks increasing, there isn’t much wiggle room for the economy to absorb the impacts of a new supply chain crisis.
It’s important to remember that economic data come in two flavors: Financial data are speculative and forward-looking, while data on the real economy better capture the state of the world, but are backward-looking. This month, we got a wave of backward-looking data that were all pretty bad, but the good news is that this was telling us information about the past: the labor market from the second week of February, inflation for all of last month, and revised GDP data from October through December of 2025.
Unfortunately, we have a pretty good idea of how things have changed this month, and signs do not point to bad news staying confined to the past—oil shocks are famously bad for the economy, and the US has created one of the largest oil disruptions in history. After a year of economic policies widely predicted to weaken the economy by raising costs and slowing job growth, a significant portion of the buffer that enabled the US economy to walk off bad news since the pandemic has eroded. How the next few months play out is highly uncertain, but with the Fed less able to cut interest rates as inflation risks climb and the odds of a recession up by most measures, it’s important to follow the data to understand where things are now and what to watch out for.
All Eyes on Energy
The energy picture over the last year shows an unusual split—OPEC drove oil prices down for much of 2025, while domestic energy prices rose. Looking backward at February CPI, energy inflation was up 0.5 percent over the year, with 10.9 percent inflation for natural gas and gasoline prices down 5.6 percent, mostly offsetting 4.8 percent electricity inflation.
Since the beginning of the year, oil prices climbed more than 10 percent as the threat of war increased. Now, the closure of the Strait of Hormuz is essentially the worst-case scenario for energy markets—things can get better or worse based only on how long it stays closed.
The energy shock is showing up aggressively in some markets and not others, based largely on how much energy was in storage already. For example, while an underfilled US Strategic Petroleum Reserve is having no price effects yet, more acute price shocks have already hit EU natural gas and US diesel, where storage levels were low before the shock. At the broader level however, this is a major oil shock for everyone—there is essentially no difference between US and EU oil prices in response.
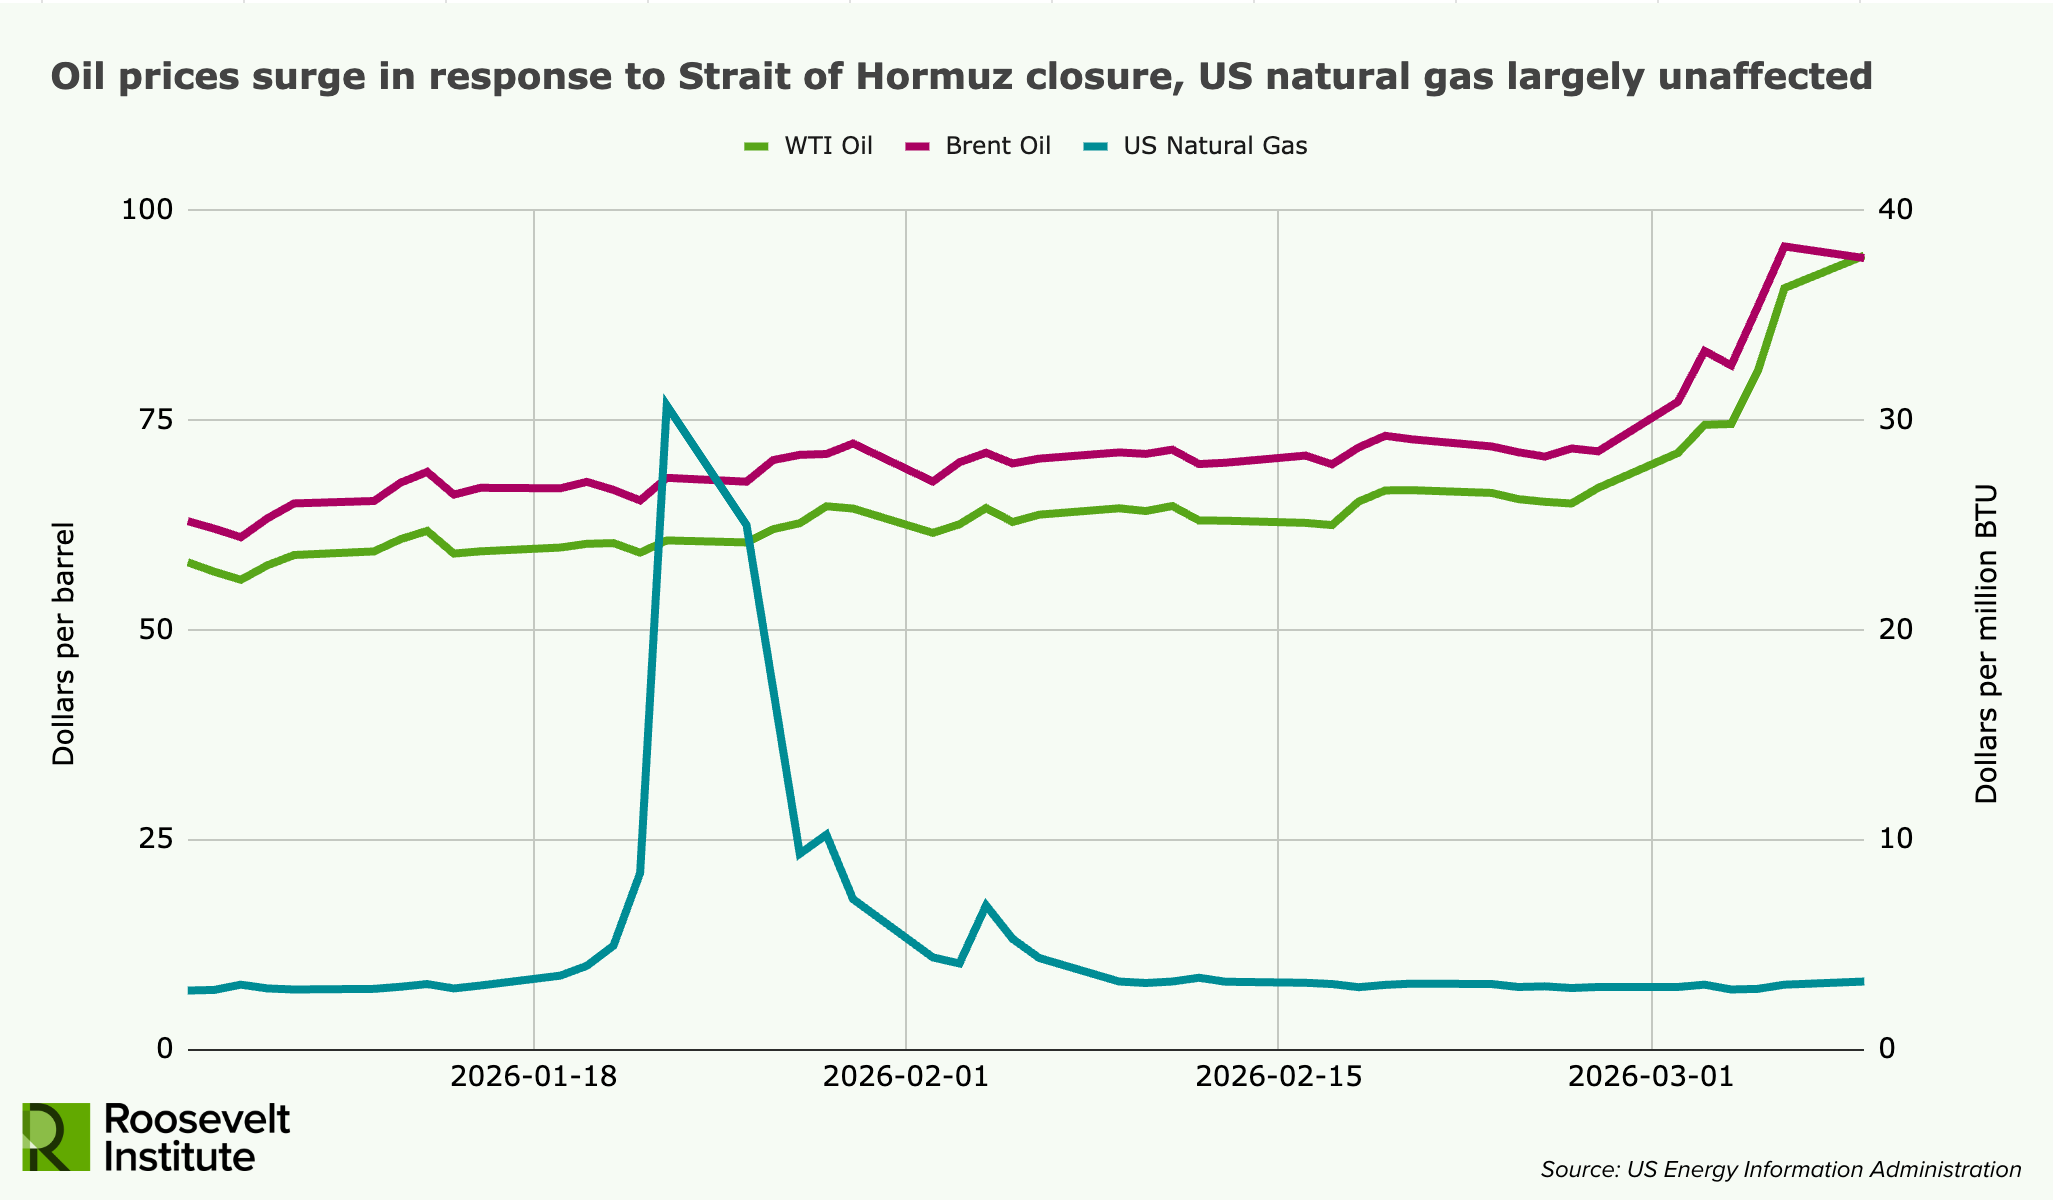
Global reductions in oil and natural gas supplies are both around 20 percent, and the US is the largest producer of both, yet the effect on US prices have been polar opposites. US oil is tightly integrated in the global market—prices of US oil rise when Persian Gulf oil goes offline, because more oil is then exported from US shores—but the US exports less than 1 percent of its natural gas production and is already at capacity, so disruptions in the Gulf don’t affect US natural gas prices. Relying primarily on domestic natural gas isn’t costless—winter storms drove a large spike in natural gas prices in January—but the wildly different response to what may become the largest energy shock in history shows two very different outcomes for average people in the world’s largest fossil fuel–producing country.
A less-appreciated risk increasingly emerging across the Gulf is that recovering from this disruption will not be easy. While oil wells can be shut in or temporarily closed, oil fields have no true pause button. Recovering oil from existing wells depends on geological pressure to push a mixture of oil, gas, and water to the surface. Shutting in a well can reduce pressure, change the mix of what comes up, and/or degrade parts of a well, causing permanent reductions in future production. Historically, this means oil production from existing wells is more driven by geology than prices—cutting output risks years of future losses. This means that even restarting every shut-in well would imply a sizable production shortfall for some time after the Gulf goes back to its prewar state.
Earlier phases of US shale production appeared to insulate against disruptions, capitalizing on high prices to expand output. Because the rate of shale oil production is rapid and declines quickly, this could offer a production reserve in case of events like this month. However, that price responsiveness didn’t show up in the supply shock caused by Russia’s invasion of Ukraine, and is unlikely to materialize here.
The Job Market
The Employment Situation for March was three releases in one, and each had a different message (I previewed these in a late-February column). The payroll data was painful, the household data was fine, and the annual update to population data was a worse-than-expected blow.
Payroll data received the most attention because it undercut a hopeful narrative. January, with its 126,000 payroll jobs, was the best month for job growth since “Liberation Day.” Plausibly, it looked like the start of a jobs recovery, given three months of increasingly positive growth totaling 220,000 jobs, with 60 percent of them in January. Things were looking up, and most of all, looking normal (in 2024, the US averaged job gains of 121,000/month).
March’s data releases dashed that narrative, with a loss of 92,000 jobs and revisions taking December from +48,000 to -17,000. The three-month gain went from 220,000 to just 17,000—much more like the bad normal of 2025, when we averaged 9,000 monthly job gains. In the details, the story is mixed: A health-care strike made the sector that drove 2025 gains a net negative. Temporary help jobs, which typically recover first when the labor market swings up, had been promising until revisions swung 3-month job gains since November from +15,000 to -18,000.
If the household survey had shown anything like that, panic levels would be much higher, but it didn’t and they aren’t—yet. The numbers were mostly meh, with a few solid bright spots: Unemployment bounced back to its December level of 4.4 percent, the employment and labor force participation rates fell by 0.1 percent and 0.01 percent respectively, and the broadest measure of unemployment, U-6, improved for a fourth straight month, along with an increase in full-time employment.
The longer-term population control revisions we flagged in our preview from last month came in worse than expected. With 1.4 million fewer employed people, employment rates are down 0.5 percent overall, with White (-0.7 percent), Black (-0.4 percent), and Hispanic/Latino (-0.3 percent) employment rates down and Asian employment rates up (+0.3 percent). On first look, these revisions mostly reflect an older estimate of the population than we expected a year ago, a headwind the economy will continue to struggle with in 2026.
Inflation
Americans can’t catch a break on inflation—not before the US assault on Iran and certainly not since it began. While annualized inflation was finally getting back under 2.5 percent for the first time since the Liberation Day surge, the month-to-month details were not moving in the right direction. Monthly inflation ticked up in February with the primary economic tailwind coming from low energy prices. Within the report, the more stubborn components that had been improving have plateaued or reversed, particularly in the shelter category.
Further up the supply chain, prices have been increasing at an increasing rate for four months: The Producer Price Index (PPI) readings from November to February came in at 0.3 percent (November 2025), 0.4 percent (December), 0.5 percent (January), and 0.7 percent (February). These price increases for individual months all predate the energy shock that’s started IRL, but is not yet reflected in the official data. What makes the timing of the anticipated oil shock especially poor is that risks to economic growth and the labor market are already growing, so the Fed will have to keep an even tighter focus on inflation.
GDP
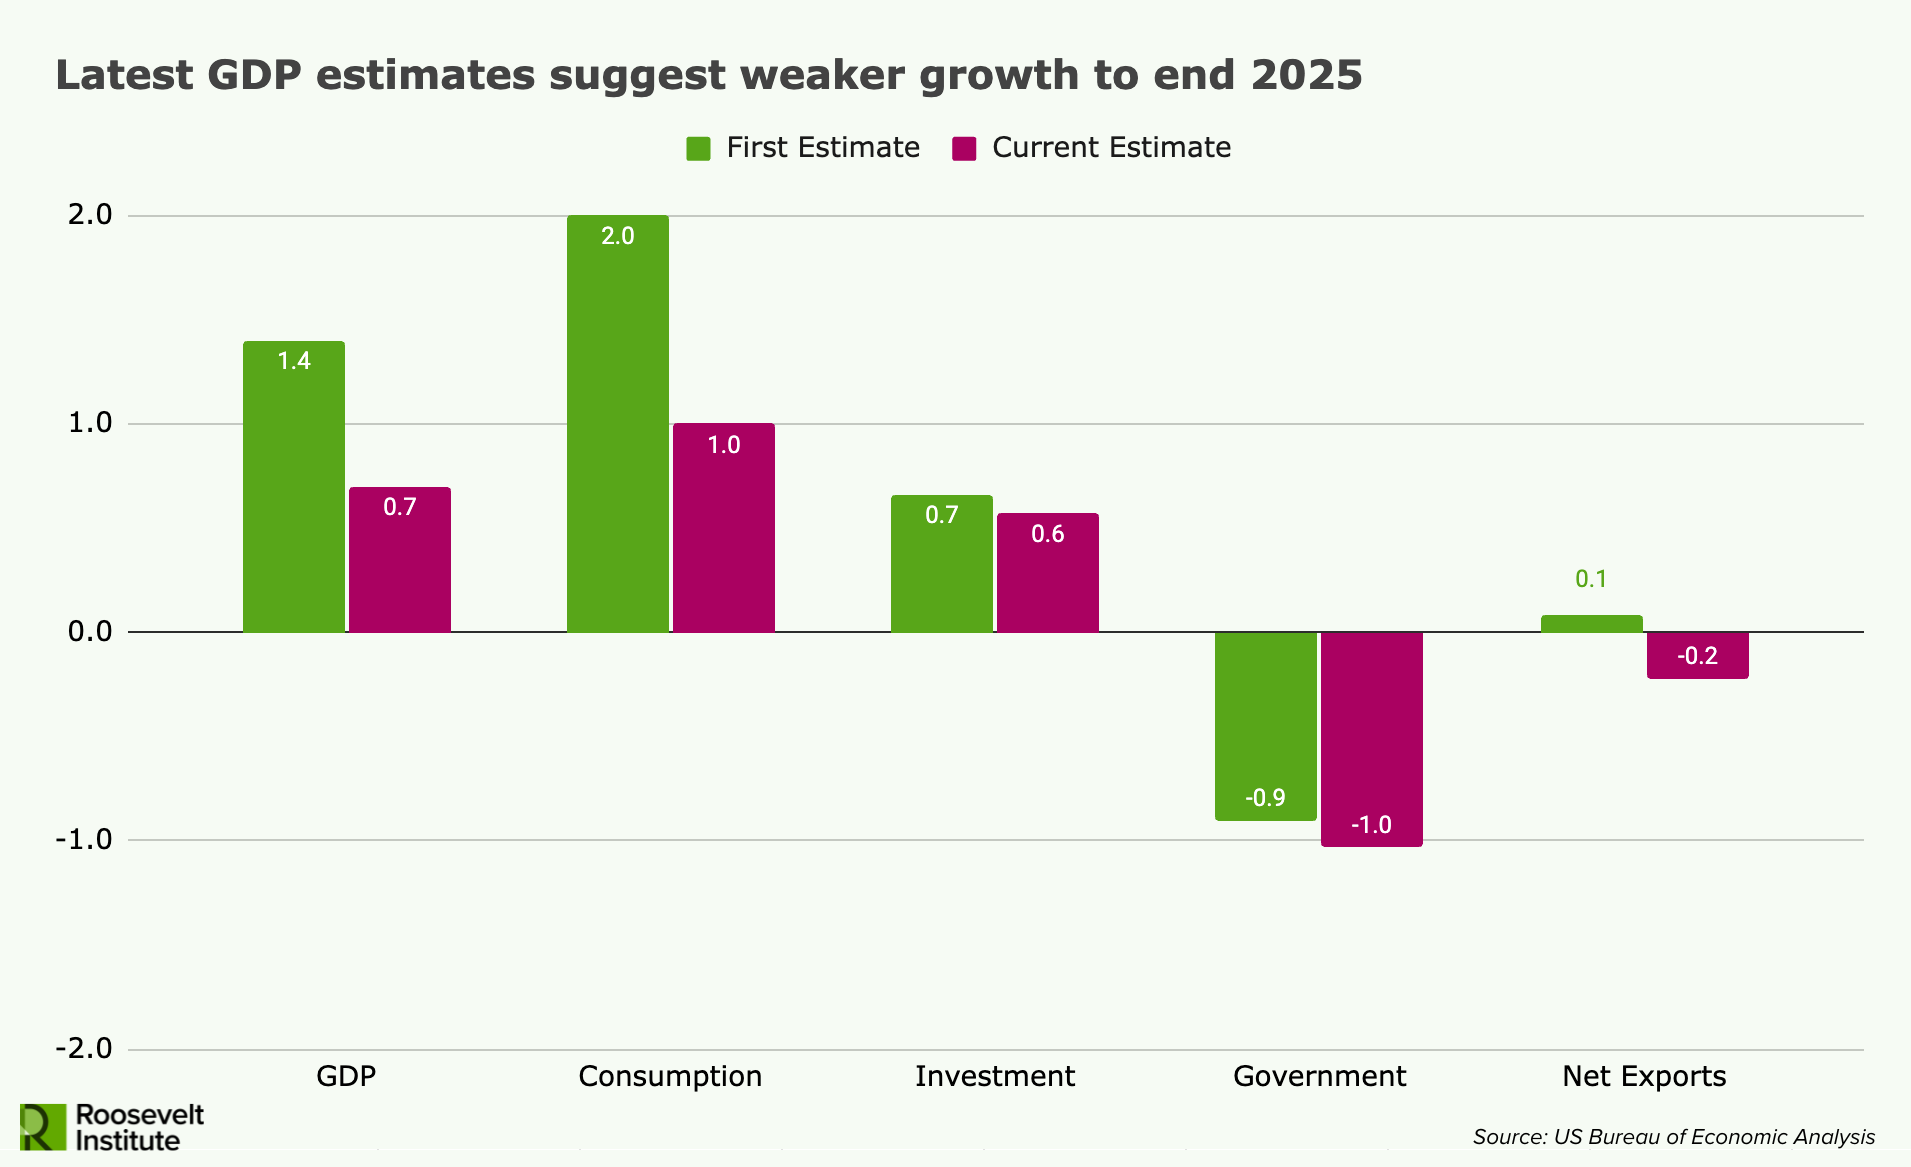
What had already looked like mediocre, if trundling along, real GDP growth of 1.4 percent to end 2025 was revised down to 0.7 percent on the second estimate (of three), with broad-based weakening in nearly every component. Notably, these figures overstate the weakness of economic growth because GDP accounting methods mean the federal government shutdown reduced GDP growth by about 1 percent in both estimates. Nonetheless, the breadth of weakness—the only positive contribution revised up was consumer spending on goods—and the large downward revision suggests the US was starting the year in a weaker position than previously thought.
What’s Next
The economy last year was chaotic, but uncertainty was more about estimating the size of the shocks, not their nature. This year looks different. Americans already see big changes at the pump, and as this disruption goes on, the primary direction of the effects are predictable: higher prices, weaker growth, and a softer job market—more of what we’ve seen since the beginning of the year. What’s less predictable is how and where the secondary effects cascade across the economy and how long they last.
Author