

Where America’s Clean Energy, Manufacturing, and Emissions Trajectories Stand One Year After the OBBB
July 28, 2026
By Joe Peck and Todd N. Tucker
One year after the so-called One Big Beautiful Bill (OBBB) pared down the clean energy tax credits implemented during the Biden administration, where is the energy transition headed? Current analysis shows that while the OBBB alone did not do quite as much damage as it could have, its slashing of solar and wind credits, along with the Trump administration’s plans to increase fossil fuel production, have pushed the previous emissions reduction goals further out of reach.
The United States’ policy posture regarding clean energy has seesawed radically over the last two decades. In the wake of the Great Recession, the Obama administration passed the American Recovery and Reinvestment Act (ARRA), which dedicated $90 billion toward renewable energy projects, and signed the Paris Climate Accords, steering the US on a course to lower emissions by 26–28 percent of 2005 levels by 2030.
In 2017, the Trump administration pulled out of the Paris Accords and rolled back over 100 environmental rules. The Biden administration rejoined the Paris Accords, setting a higher goal of 50–52 percent of 2005 emissions, and enacted the Inflation Reduction Act (IRA), which was expected to contribute between $400 billion and $1.2 trillion toward clean energy, far outstripping the size of Obama’s ARRA.
Most recently, the second Trump administration pulled the US out of Paris (again) and pledged to slash the IRA. Yet the president was only partly successful in the latter, as congressional Republicans rallied to preserve many of Biden’s tax credits in the OBBB.
This piece examines
- the state of US energy production across different technologies;
- private investment in these sources within the context of clean manufacturing and decarbonization projects more broadly;
- the potential impact of tax credit changes on these outcomes; and, finally,
- what all this seesawing has meant for the United States’ emissions trajectory.
Overview of Energy Production
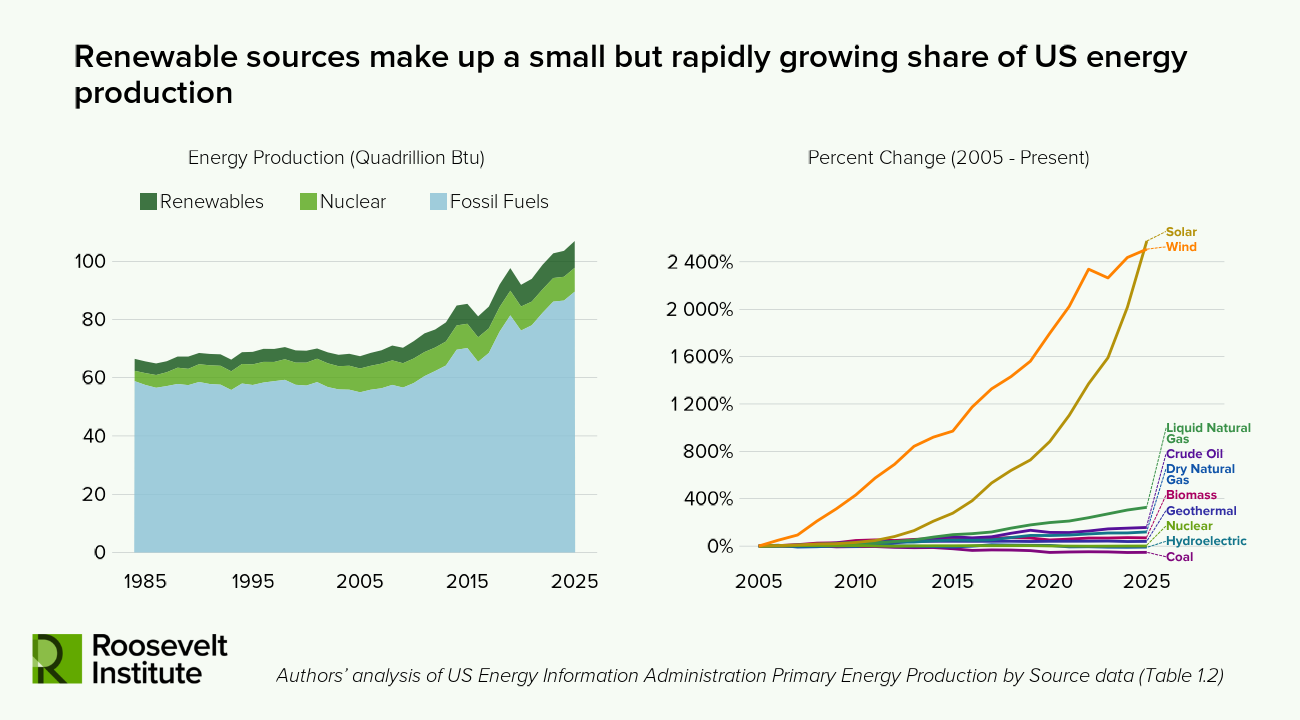
Until now, the production of clean energy in the United States has been marked by two stark, yet seemingly incongruous, features. First, the vast majority of energy produced comes from fossil fuels. Second, solar and wind production has vastly outgrown other sources of energy since 2005 (Figure 1), as America’s energy infrastructure undertakes a steady transition to renewable sources.
Figure 1
How Investment Is Driving Changes in Energy Production
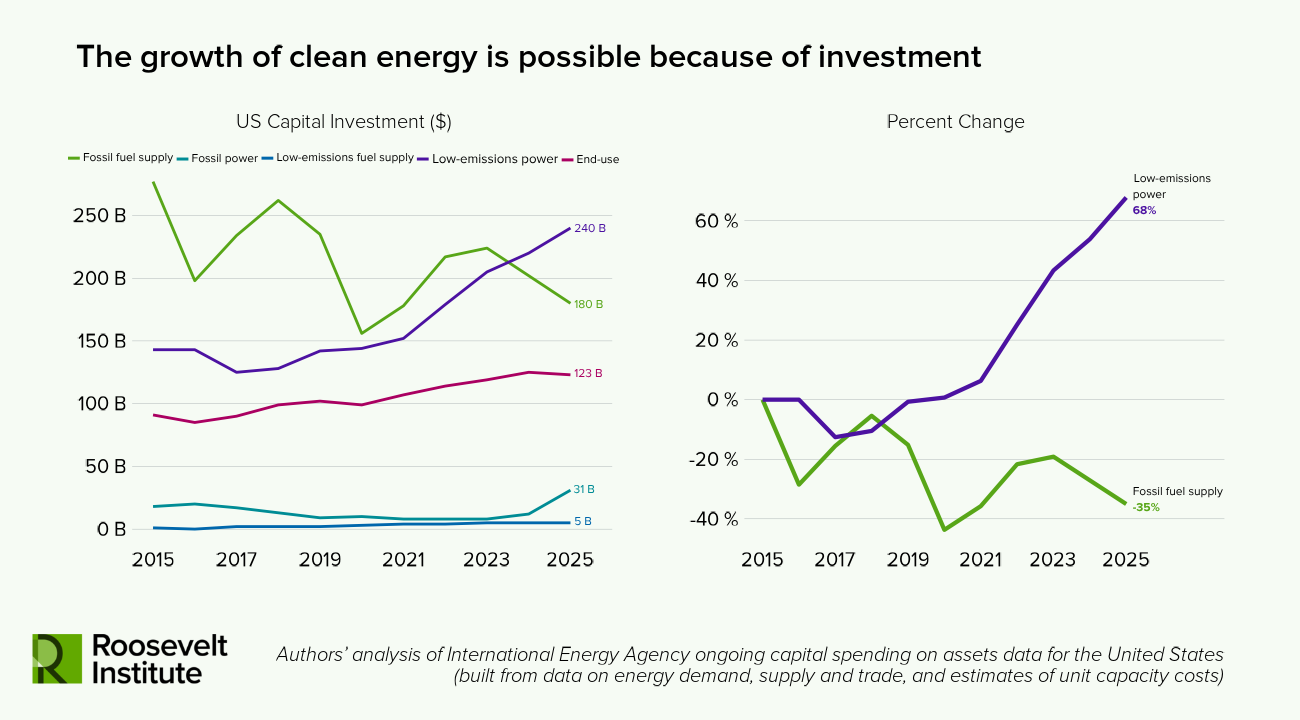
The rapid growth of solar and wind electricity production has been reinforced by higher amounts of capital investment in these sectors (Figure 2). Investment in low-emission power and fuel supply was less than half that of fossil fuels in 2015. A decade on, total investment in clean energy was $245 billion, 16 percent higher than for dirty sources. The 68 percent increase in low-emissions investment over this period has proven vital to the sector’s growth, as the cost of producing clean energy (though having fallen in recent decades) requires significant capital upfront.
Figure 2.
Though clean investment has increased over the last decade, it still faces headwinds. Frequent policy changes, high upfront costs, technological risks, and higher costs of commercializing still-maturing technologies make investors weary and inhibit the amount of private finance available to clean technologies. In all, this leaves an investment gap between the investment needed and the investment provided for a clean transition that falls to public institutions to bridge and spur.
The trifecta of investment bills passed by the 117th Congress and signed by President Biden aimed in part to do this. Total clean investment announced in 2022, 2023, and 2024 was 2.4 times that of the previous three years ($695 billion vs. $288 billion), peaking at $104 billion in the quarter following passage of the largest of the three, the IRA, in August 2022.
Donald Trump was elected on a promise to undo this progress. So when the president and the Republican-controlled Congress met in early 2025 to agree on their fiscal agenda, early proposals envisioned a complete elimination of the IRA tax credits. Over the six months of negotiations between the legislative chambers and the White House, many tax credits were modified but not completely eliminated. For example, technologies like geothermal or nuclear will continue to benefit from subsidies through the early part of the 2030s, as will those for clean energy manufacturing inputs (like battery production).
But the most significant casualty of the process (alongside consumer subsidies for electric vehicles) were wind and solar tax credits. Unless ground was broken by this month (or put in service by the end of 2027), these projects will not receive subsidies.
So first, the bad news.
The withdrawal of federal support has impacted the rate of project cancellations. As shown in Figure 3, clean energy project cancellations were pretty rare before Trump came to office. In 2023, the IRA’s first full year of implementation, only $11 billion of planned investment was cancelled—or 5 percent of the total investment announced in this period. In 2025, the year Trump entered office for the second time, that number topped $57 billion, or 41 percent of $139 billion of investment announced.
The extent to which tax credit withdrawals have limited the trajectory of future investment remains to be seen. However, early evidence suggests that project cancellations are concentrated among those who have lost federal support: 64 percent of investments canceled since July 2025 had their subsidies pared back or eliminated under the OBBB. (A future blog post will separately examine the fate of grant programs.)
Figure 3.
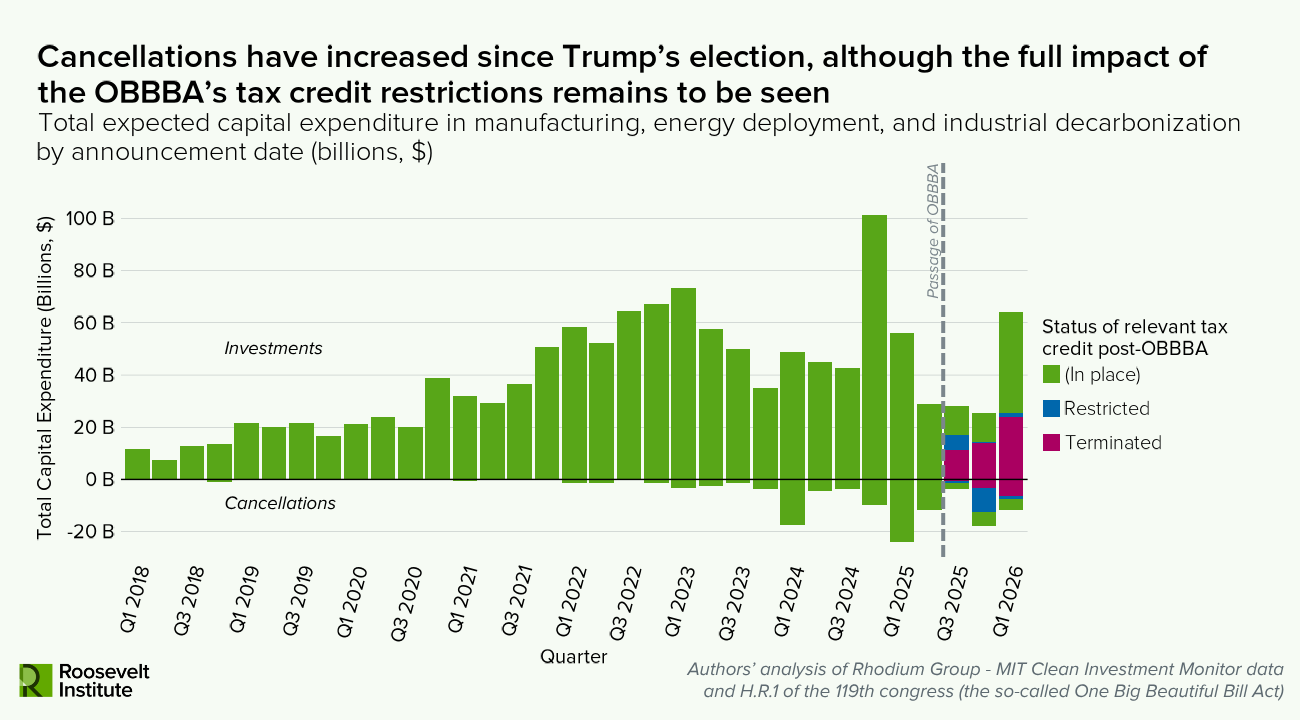
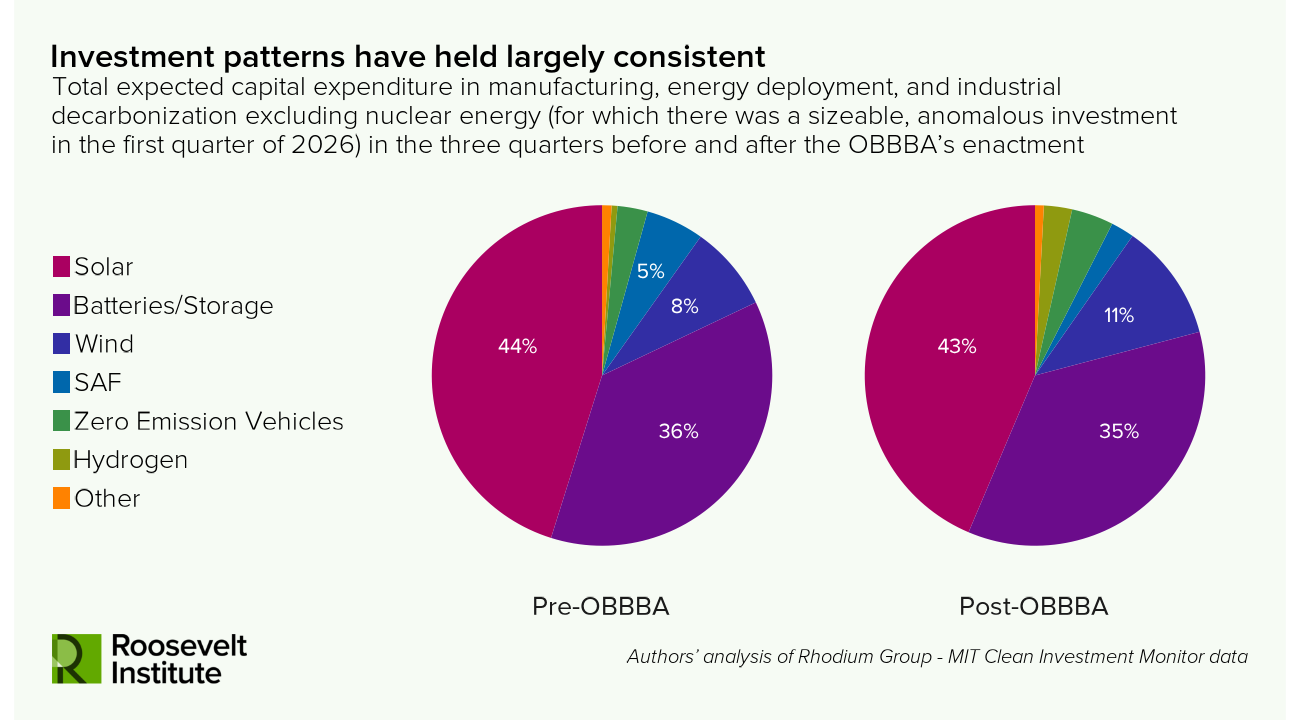
The good news is that project cancellations are still relatively rare. The data north of the x-axis in Figure 3 still vastly outnumber those to the south. Indeed, a sizable 49 percent of new project announcements since the OBBB are moving ahead without the full benefit of IRA-era tax credits. Moreover, the phase-down of wind and solar subsidies does not appear to have shifted the pattern of investment considerably. A similar portion of investments were announced in solar energy over the three quarters after the OBBB as in the same period prior (Figure 4).
Figure 4.
Is this due to overall market competitiveness of these technologies, rise of demand from AI, or other factors? While it is beyond the scope of this piece to definitively determine this, Center on Global Energy Policy visiting fellow Lily Bermel, in comparing models looking at the impacts of the IRA and OBBB, finds that, on average, the majority of clean capacity (74 percent) will still be on the grid through 2035 relative to 2021 levels. Specifically, she attributes that to the near-term deployment pipeline, which is “robust and, in many ways locked in: Rhodium Group projects the same clean capacity additions through 2030 across its low, middle, and high emissions scenarios. This is in part due to the tax credit eligibility of safe-harbored wind and solar projects through 2030 and for other technologies through 2037.”
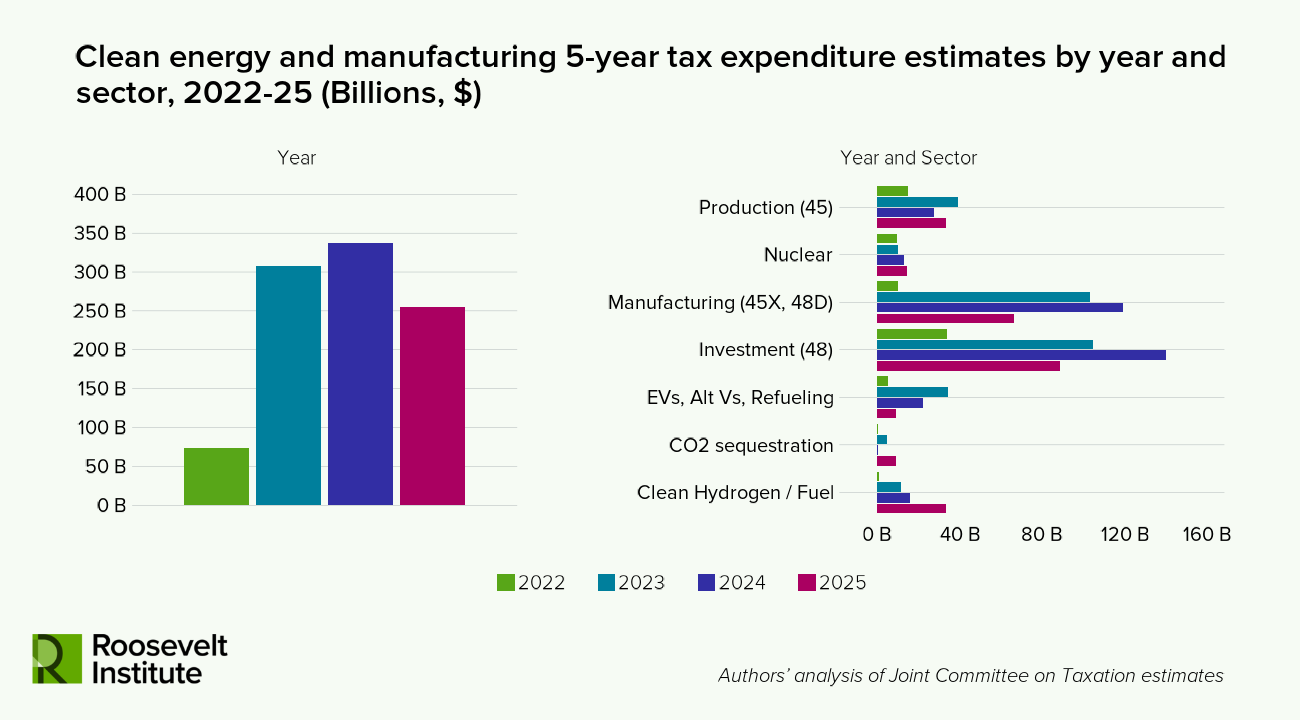
Moreover, demand for clean energy investments outpaced initial modeling. In December 2022, just a few months after the IRA’s passage, Congress’s Joint Committee on Taxation estimated that the five-year price tag for IRA tax credits would be around $80 billion. As uptake of clean energy incentives outpaced earlier projections, these estimates had to be revised upward to four times that. (This echoes the revisions to budgetary estimates, which doubled between enactment and 2024—though budget numbers and tax expenditure numbers are not directly comparable.) While the OBBB has, naturally, turned estimates back down, they still remain around three times the initial five-year estimates for the IRA (and the ARRA total clean energy spend), as shown in Figures 5 and 5b.
Figures 5a and 5b.
What Has This Meant for Emissions?
Although the glass is half full when it comes to IRA repeal, the OBBB broke the link between supply for clean inputs and demand from clean power providers. Only the latter can lead to emissions reductions: Emissions fall when energy infrastructure is deployed, not when capacity is built.
So what’s the damage on the emissions front? Modeling conducted in 2025 by the Princeton University ZERO Lab shows that Biden-era policies were on course to reduce emissions by between 40 percent and 44 percent of 2005 levels by 2035 (roughly 80 percent of the way toward the Paris goal). The OBBB will fall much short of that, and leave emissions only 25 percent below 2005 levels, because it pared back many of the IRA’s clean energy subsidies. Notably, however, travel is still naturally in the correct direction, and the emissions reduction is roughly on par with what the Obama administration committed to.
Other models project the gap between the IRA’s and OBBB’s 2035 emissions to be smaller, but still significant (Figure 6). The Rhodium Group finds that the OBBB would leave the US emitting 68 percent of 2005 levels (compared to 59 percent under the IRA), and Energy Innovations projects 59 percent (compared to 55 percent under the IRA)—the smallest gap with the IRA of the three estimates ). Notably, these other projections still have the US surpassing the Obama-era goals.
Figure 6.
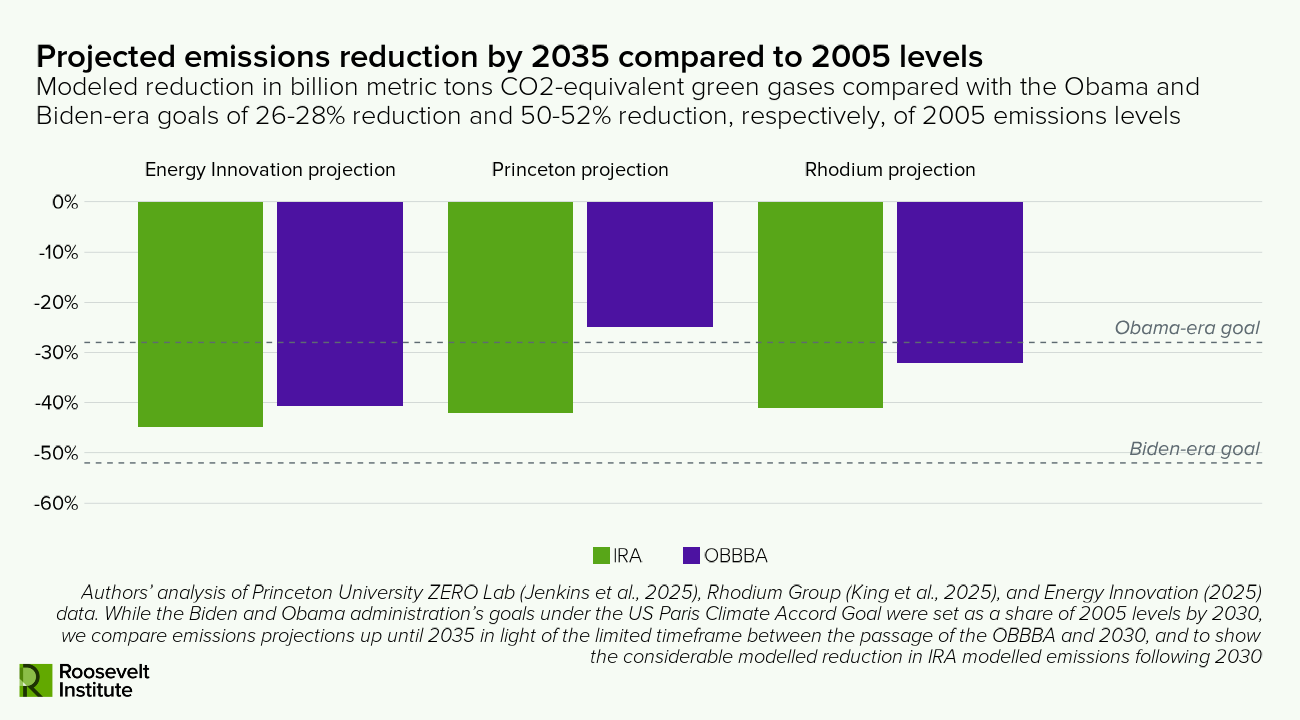
These projections, which already show that the OBBB will raise emissions relative to the IRA, do not account for Trump’s moves to increase fossil fuel extraction in the United States, which will further increase emissions. Without further changes, the burden of closing that gap will be left—along with an ever warmer planet—to the next generation.
The authors thank Lily Bermel, Brendan Duke, Suzanne Kahn, Bobby Kogan, Toyosi Odusola, Casey Schoeneberger, and Aastha Uprety for their inputs.
Authors