The Persistence of Post-pandemic Shelter Inflation and the Housing Affordability Crisis
March 13, 2025
By Ira Regmi
Introduction
The United States faces a severe housing affordability crisis as a key component of post-pandemic inflation, with shelter costs now dominating overall price pressures. While other inflationary factors have eased, shelter inflation remains stubbornly high. Shelter costs play an outsized role in inflation measurements, making up roughly 36 percent of the consumer price index (CPI)—the largest share of any category. This reflects shelter’s fundamental role in household budgets, consuming up to 40 percent of expenses in major metropolitan areas such as New York and San Francisco (DiNapoli and Jain 2024).
This paper examines shelter inflation’s complex dynamics through a monetary policy lens, analyzing its distinct trajectory during and after the COVID-19 pandemic. Section 1 traces shelter inflation’s post-pandemic path through three phases, showing how it began rising in March 2021, peaked later than overall inflation, and has declined more slowly than other sectors.
Section 2 investigates the gaps between different measures of shelter inflation, particularly the significant delay between CPI shelter measurements and actual market rents. This section explores how various indices track rental market changes and what these measurement differences mean for economic policy. Section 3 addresses key issues in the CPI shelter component, focusing on the challenges of measuring owners’ equivalent rent (OER)—the amount owners estimate they could charge to rent out their current residence.
Section 4 analyzes how Federal Reserve interest rate decisions affect housing costs through multiple channels, examining both immediate and long-term effects on housing supply, construction starts, and rental markets. Section 5 documents the current housing affordability crisis, showing how rising homeownership costs have forced many Americans into renting, with rental units now constituting about 35 percent of total occupied housing (US Census Bureau 2023). Throughout, this paper illuminates how shelter inflation has evolved since the pandemic, its measurement challenges, and its broader implications for housing affordability and monetary policy.
The Trajectory of Shelter Inflation Since the COVID-19 Pandemic
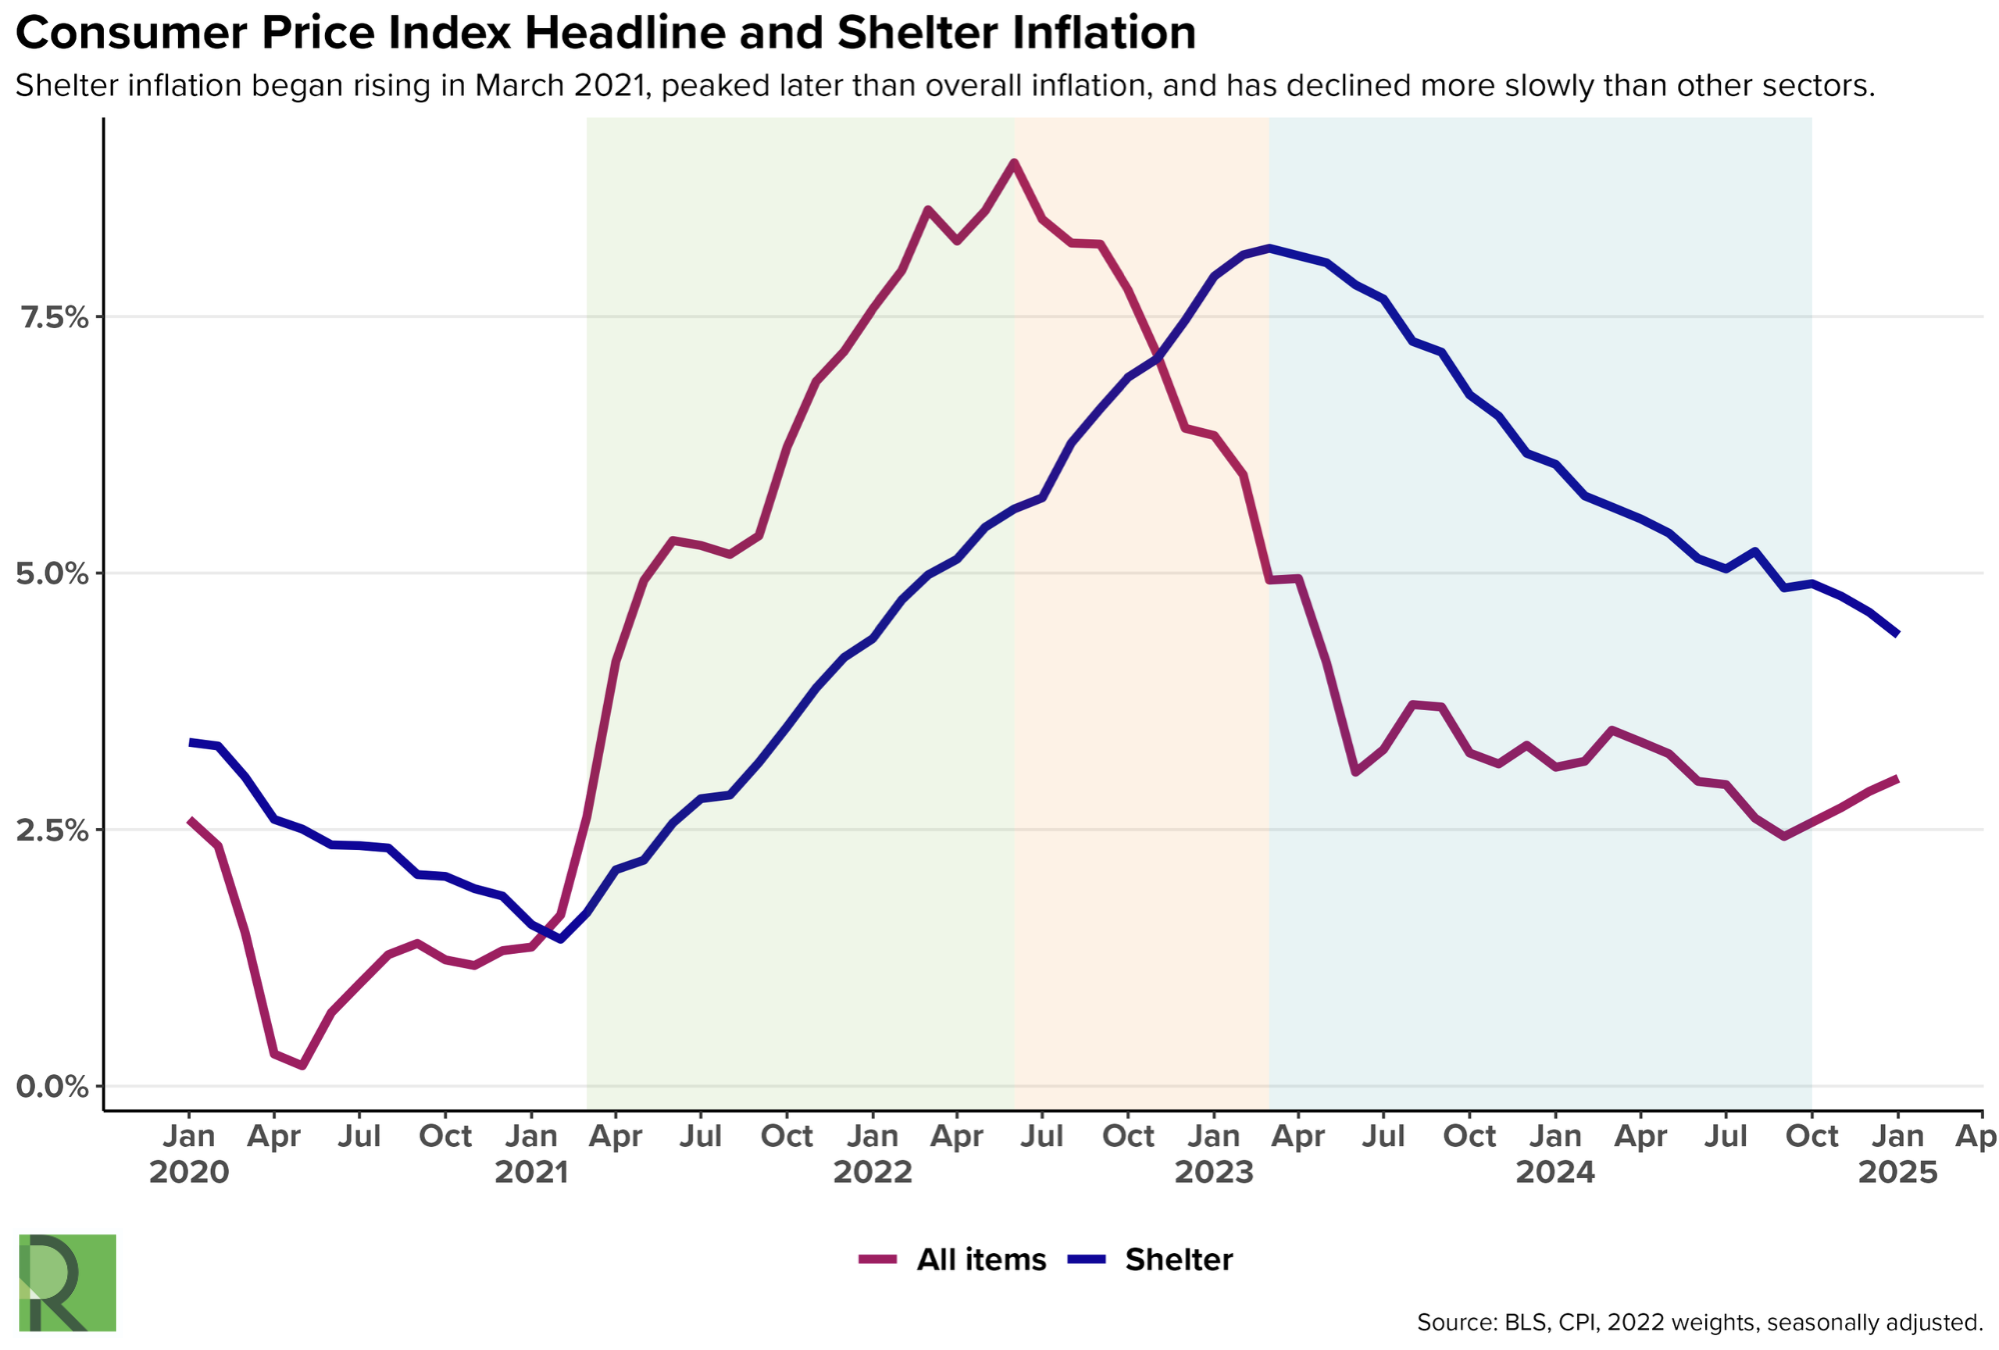
Figure 1
The first leg of this trajectory (see Figure 1, shaded in green), the initial rise in shelter inflation coinciding with a rise in aggregate inflation, started in March 2021 and ended in June 2022, when overall inflation peaked. Inflation in shelter during this phase can mostly be explained by rapid changes in living preferences as a result of the COVID-19 pandemic. An increase in the rate of second-home ownership, as households experienced a collective preference for larger multifamily homes and location changes due to the pandemic (Anderson 2022), raised the demand for housing. In addition, migration from high-cost metro areas to lower-cost metro areas increased housing demand and therefore prices in these areas, especially in the Southern US, where the average cost of renting was lower than the national average (Williams 2022). While some of these pandemic-induced demand pattern changes have reverted to pre-pandemic trends, housing adjustments take time and create price shifts.
The second phase (see Figure 1, shaded in orange), where the aggregate inflation measure began to slow down but shelter inflation continued to rise rapidly, occurred between June 2022 and March 2023. By mid-2023, shelter inflation remained among the dominant drivers of the overall inflation rate, stubbornly refusing to fall at a pace similar to other components. While some primary drivers of inflation in 2022 adjusted much faster, housing costs remained elevated. For instance, energy prices, which peaked at 41.6 percent inflation in June 2022, were already experiencing disinflation—or a fall in prices—by June 2023. Though energy prices are volatile and saw increases again, they reached a high of only 3.5 percent inflation in May 2024. Similarly, automobile prices (new and used vehicles), which fueled much of the inflation in 2022, also showed signs of disinflation a year after peaking at 23.7 percent inflation in February 2022. This phase stands out particularly in shelter inflation’s relation to the trajectory of the overall inflation, reflecting the idea that supply shocks and sectoral forces rather than macroeconomic events were driving inflation.
Supply chain disruptions due to the COVID-19 pandemic and subsequent price gouging by large corporations were among the primary causes of the inflation, especially as the economy fluctuated rapidly between increased demands for goods in the early days and increased demand for services as the economy reopened in April 2021. The sudden appearance of strong supply shocks allowed corporations to maintain high prices and rake in record profits by artificially maintaining high prices (Weber and Wasner 2023; Weber et al. 2024). During the first half of 2021, vehicle prices accounted for almost the whole rise in inflation. For much of 2022, it was mostly energy prices. As we saw in Figure 1, shelter prices began to accelerate in February 2021, quickly surpassed pre-pandemic levels by October 2021, and continued to rise even as other pressures on overall inflation, such as those from supply chain issues and corporate profits, began to settle.
The third phase of the trajectory (see Figure 1, shaded in blue), where shelter inflation underwent a gradual decline, began in April 2023. Shelter inflation has not yet returned to pre-pandemic levels, though multiple studies indicate it will eventually; research suggests that CPI inflation will catch up with market rents, but predictions vary on the timing. Due to a market rent–shelter inflation gap of about 6 percent observed in March 2024, some studies predicted continued growth in CPI shelter inflation. Such a large divergence was expected to lead to a 1.6 percentage point increase in CPI shelter inflation over the next 12 months compared to a no-gap scenario, though the gap is expected to close quickly (Cotton 2024). Some researchers projected shelter inflation would return to pre-pandemic levels by the end of 2024 (Jordà and Yalcin 2024), and some forecast convergence between market rents (rents that adjust in real time or monthly) and contract rents (rents that adjust over a designated contract period) by the end of 2025 (McKay and Mehrotra 2024).
Divergence Across Measures of Shelter Inflation
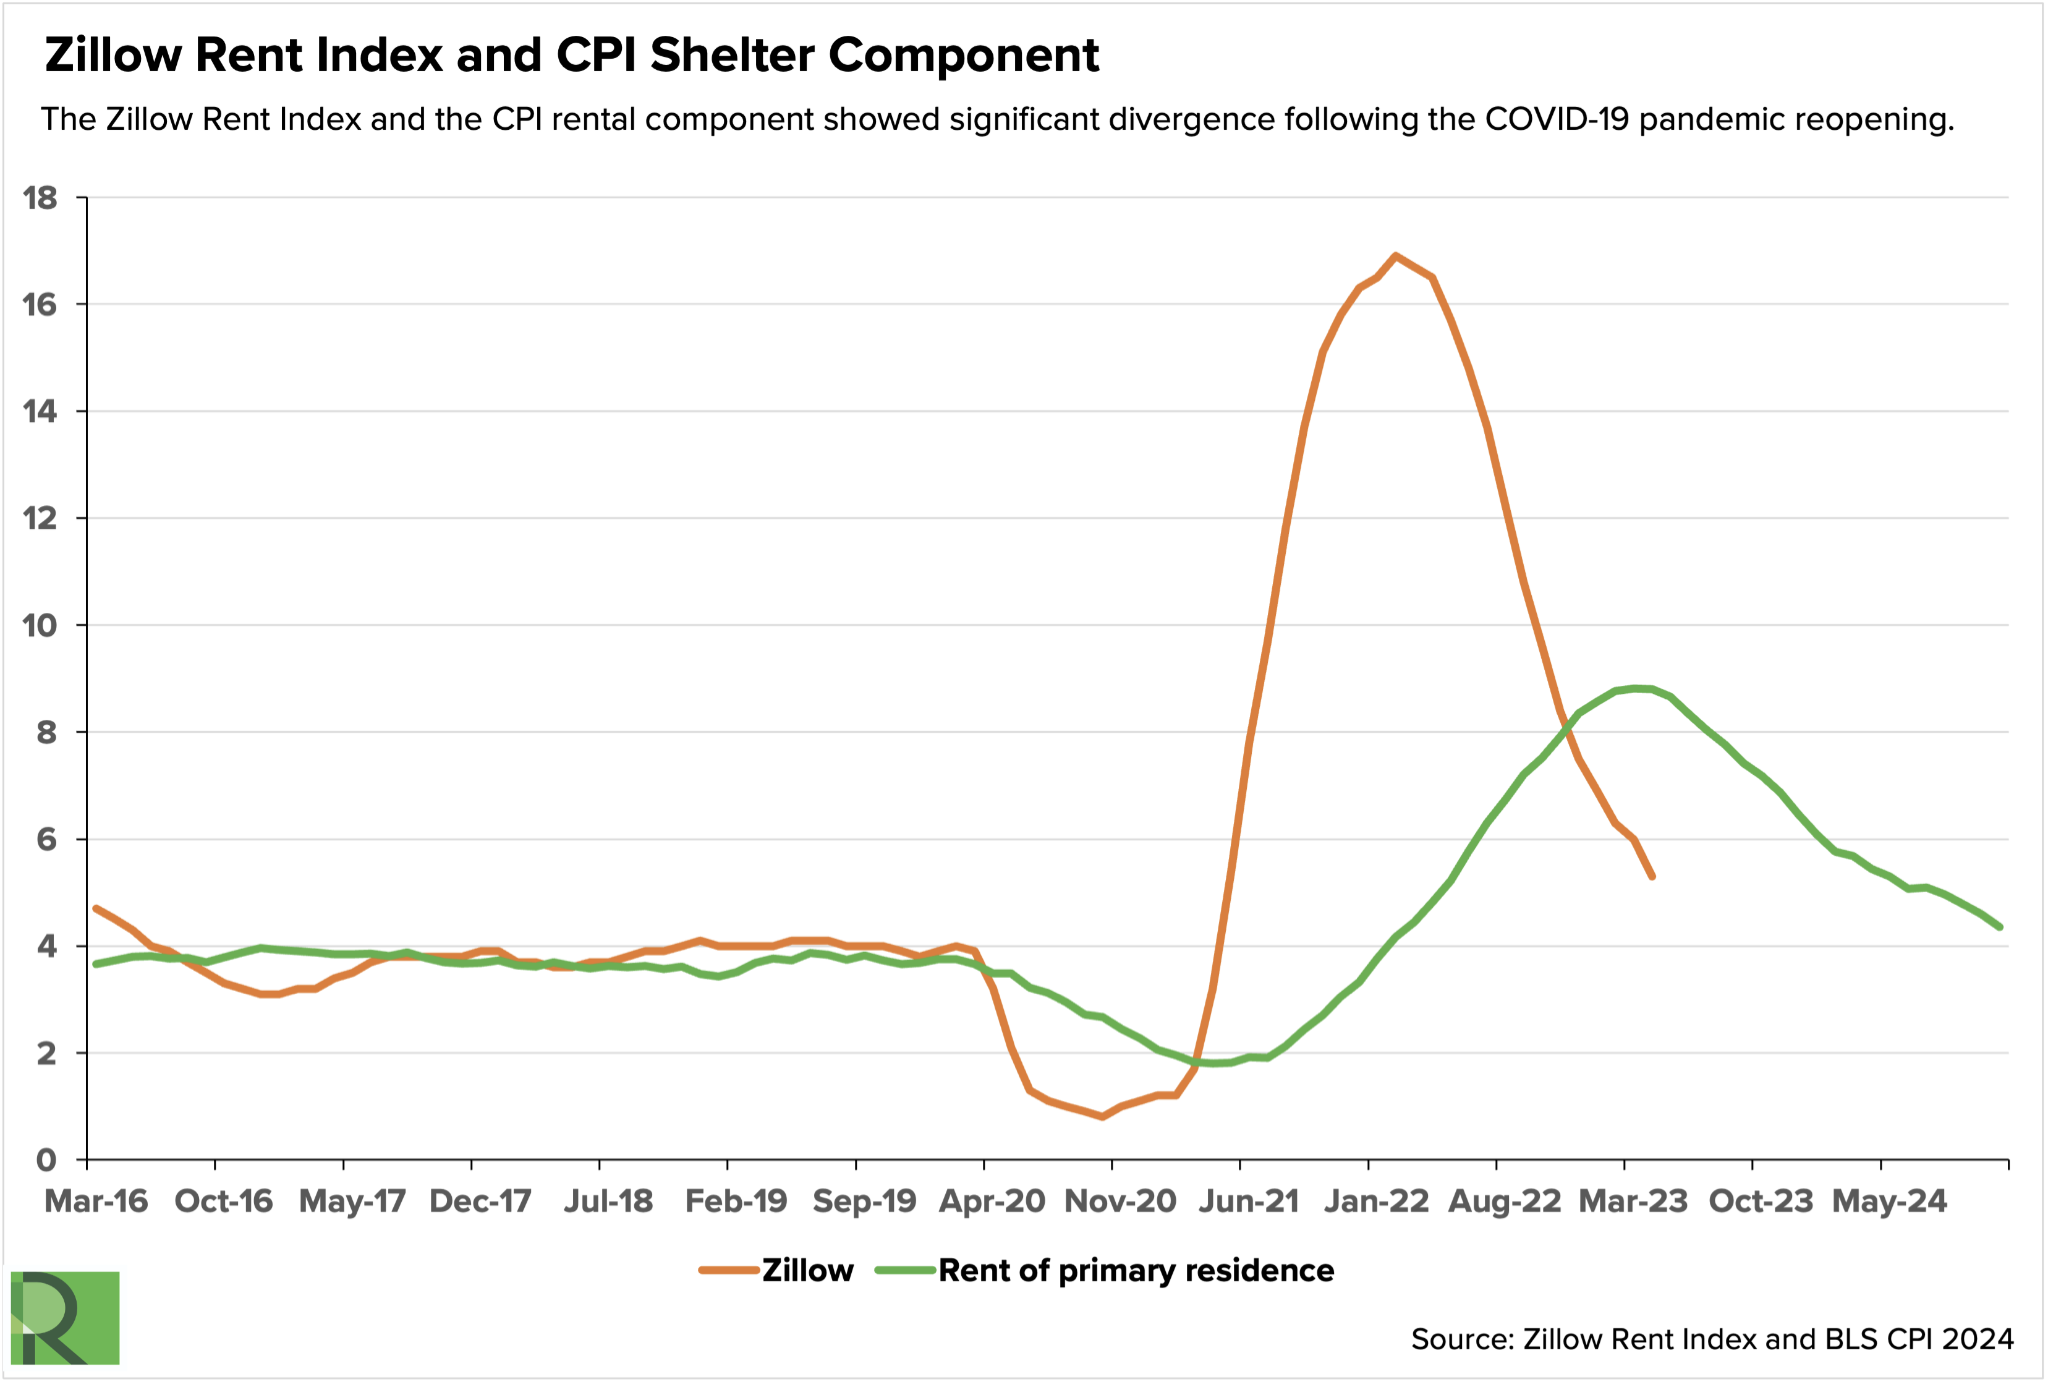
Figure 2
While the trajectory and especially the timing of the CPI shelter inflation is hard to predict with precision, certain measurement issues cause CPI shelter inflation to operate with a lag. One important reason for this lag is that market rent reflects only the rents paid by new tenants, whereas the CPI shelter metric captures rents paid by new and existing tenants alike (Cotton 2024).
In January 2022, while the official CPI for rent was only 4.43 percent, the Zillow Observed Rent Index (ZORI) and the Marginal Rent Index (MRI) reported annualized inflation rates of 16.5 percent (see Figure 2) and 11.4 percent, respectively (Zillow Economic Research 2024; Penn State University n.d.). By December 2022, the CPI rent measure was 8.3 percent year-over-year and still rising whereas the ZORI was at 7.5 percent and had been falling since March 2022. If the Zillow readings had replaced the official CPI rent measures, the 12-month all-items CPI for May 2022 would have been more than 3 percentage points higher (Adams et al. 2022). When the CPI rent measure first started falling to 8.8 percent in April 2023, the ZORI was already down to 5.3 percent. These discrepancies exceed the historical CPI biases identified by the Boskin Commission—which found that the CPI was systematically overstating inflation by approximately 1.1 percentage points annually (Gordon 2006)—and are substantially larger than current biases documented in other studies.
Differences of this magnitude have significant implications for housing economics, monetary policy decisions, contract escalation, and GDP and welfare measurement. For instance, if ZORI had replaced the official CPI shelter inflation measures, real wage estimates would have fallen by nearly 5 percent between January 2021 and January 2022, compared to the 1.5 percent decrease reported. Additionally, Social Security cost-of-living adjustments would have been $17 billion higher in 2022 (Adams et al. 2022).
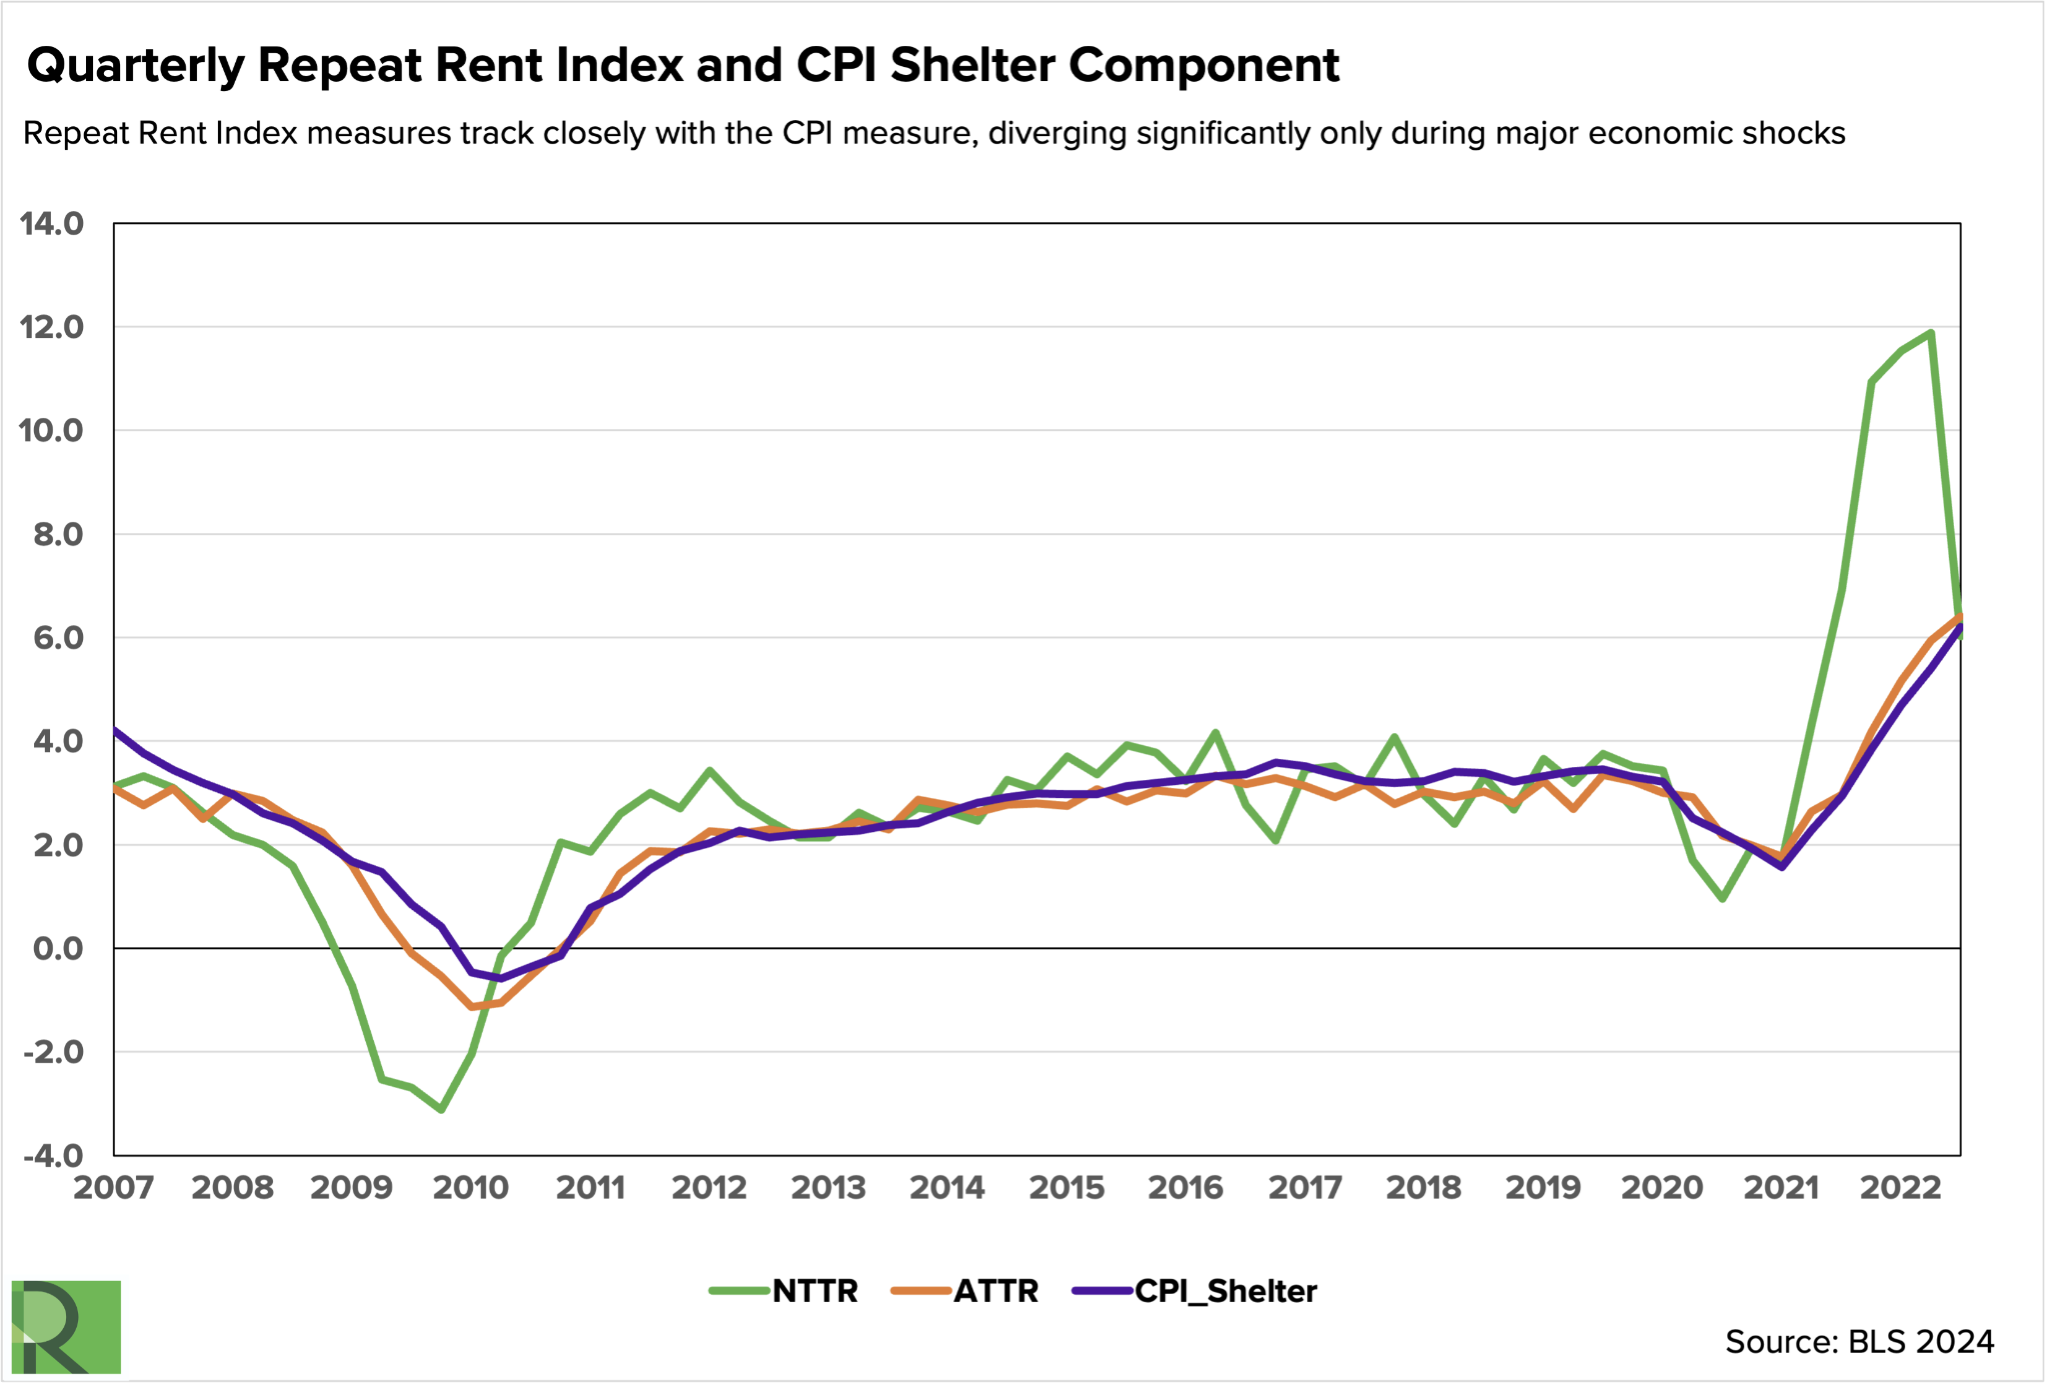
Figure 3
Using the same microdata underlying official measures of CPI shelter inflation, Brian Adams et al. created two weighted repeat-rent indices: the new-tenant repeat-rent (NTRR) index, which uses leases from tenants who recently moved in, and the all-tenant repeat-rent (ATRR) index, which includes all tenants, regardless of how recently they moved in. Their findings indicate that the majority of the discrepancies between CPI rent and other measures are due to scope differences—specifically, the differences in rent increases for all tenants versus new tenants. For instance, in the second quarter of 2022, the ATRR index recorded a year-over-year inflation rate of 6.73 percent, while the NTRR inflation rate was 11.95 percent. In contrast, CPI rent inflation was at 5.14 percent (see Figure 3) (Adams et al. 2022). As shown in Figure 3, these measures track closely with the CPI measure, diverging significantly only during major economic shocks such as the Great Recession or the COVID-19 pandemic—similar to Zillow’s data.
Suggested Citation
See the citation
Regmi, Ira. 2025. “The Persistence of Post-pandemic Shelter Inflation and the Housing Affordability Crisis.” Roosevelt Institute, March 13, 2025.
Author