The New Private Equity: Corporate Raider, Main Street Invader, Monopoly Builder, Shadow Owner
October 22, 2026
By Charlie Eaton, Albina Gibadullina, Adam Goldstein, and Marie-Lou Laprise

This is a web-friendly preview of the report.

Key Takeaways
- Private equity plays four interconnected roles in the US economy: corporate raider, Main Street invader, monopoly builder, and shadow owner.
- Over time, private equity has shifted away from its traditional corporate raider role to increasingly focus on absorbing and overhauling private “Main Street” companies.
- Economic transformations involving private equity may augur a new “dark mode” of shareholder value capitalism that can shield firms from market, consumer, or public interest pressures.
Introduction: The Four Roles of the New Private Equity
This paper assembles comprehensive data from several proprietary sources to provide the most detailed picture to date of the shifting organization, scope, strategies, and roles of private equity in the US economy since the 1980s.
Private equity investment firms have played key roles in several recent transformations of the US economy, including corporate restructuring, the rise of shareholder value ideology, deunionization, and the growth of billionaire wealth (Shleifer and Summers 1988; Kaplan and Rauh 2010; Appelbaum and Batt 2014; Davis 2016; Saez and Zucman 2022). Private equity firms manage funds that invest in illiquid assets, namely ownership stakes in private businesses. However, because businesses under private equity ownership are exempt from many reporting requirements that apply to publicly traded companies, the full shape of private equity’s expanding role has remained opaque (Ballou 2023; Coates 2023). Without standardized, publicly available data, analysts have struggled to measure the varieties or even the overall extent of private equity ownership and its influence in the real economy.
This paper assembles comprehensive data from several proprietary sources to provide the most detailed picture to date of the shifting organization, scope, strategies, and roles of private equity in the US economy since the 1980s. Our goal is to build on the primarily case-study and industry-level literature to develop a systematic synthetic account of private equity’s place in American capitalism.
We propose that private equity has increased its controlling stakes in nonfinancial firms across the US economy by assuming four typical modalities or roles that are not mutually exclusive: (1) corporate raider, (2) Main Street invader, (3) monopoly builder, and (4) shadow owner. Private equity is best known for the corporate raiding of public corporations that predominated early in its history. But the new private equity expanded through the growth of all four of its roles in conjunction and combination with one another. Private equity has thus become a nonbank financial intermediary for outside investors that exercises ownership, allocates capital, and accumulates wealth across a much larger swath of the economy than previously recognized (Lin and Pernell 2026). With fee structures that capture large shares of returns from this growing portion of the economy, private equity managers have become one of the biggest blocs of Americans with the highest incomes and wealth (Kaplan and Rauh 2010; Eaton and Gibadullina 2025).
To advance our argument, we assemble measures of private equity’s ownership reach, buyout volumes, and investment exit transactions. This reveals, first, that private equity (PE) and venture capital–controlled portfolio companies grew from negligible total net asset values (NAV) in the early 1990s to a substantial share of the economy by the 2020s. We estimate that PE and venture capital (VC) portfolio company values (excluding dry powder) comprised between 9 and 15 percent of all US nonfinancial (including noncorporate) business net worth in 2023. Through its growth, private equity carries the logic of shareholder value maximization beyond the domain of publicly traded corporations (which comprise about 25 percent of total nonfinancial business net worth) and into the domain of privately owned corporations, which make up around 35 percent of nonfinancial business net worth.1
The expansion of private equity ownership, however, does not amount to an “eclipse of the public corporation,” as predicted by Jensen (1989) and others (Davis 2016). We show that rather than checking or displacing public corporations, as private equity has grown, it has complemented public corporate consolidation as private equity’s chief roles shifted from corporate raider to Main Street invader, monopoly builder, and shadow owner. We document this shift using author-augmented data from PitchBook on 56,974 buyouts and 21,363 exits from 1985 to 2019 to estimate the distribution of buyout and exit types associated with these different roles over time.2
Private equity is often misperceived as a check against corporate concentration. This may flow from lingering memories of hostile takeovers by corporate raiders in the 1980s. We find, however, that the share of leveraged buyout (LBO) deal dollars involving buyouts of public corporations fell from more than 70 percent in the 1980s to less than 50 percent (much less, in some of our estimates) in almost all years since the early 1990s. With the number of publicly traded buyout targets dwindling, private equity has increasingly engaged in buyouts of already-private firms. Through these private LBOs, private equity invaded Main Street, often acquiring locally owned enterprises in sectors with high proportions of nonprofit entities, municipal ownership, partnerships, and closely held family businesses. Yet the dollar value of the shift away from corporate raiding has been underreported in private equity deal databases because deal values for private buyouts are infrequently reported.
In shifting to Main Street invading, private equity departed from the “slicing-and-dicing” strategy of corporate raiders, which reorganized, downsized, and resold leaner firms or their divisions. In contrast, we find that buyouts of already private firms are more often oriented toward strategies of agglomeration (“monopoly building”), and long-term, ongoing private ownership that exploits the regulatory opacity of nonpublic forms (“shadow ownership”) (Leuz and Wysocki 2016; Ewens and Farre-Mensa 2020; Coates 2023). We do not apply the term monopoly here in a strict technical sense. Instead, our claim is that private equity as a monopoly builder increasingly grows its portfolio firms by accreting their competition rather than making them leaner. This monopoly building involves add-on buyouts, through which private equity acquires and folds competitors into its portfolio companies. Add-ons grew from negligible shares to more than 40 percent of buyout dollars in recent years. Exit transaction analyses show that private equity also contributes indirectly to corporate consolidation through merger-and-acquisition (M&A) sales of portfolio companies to publicly traded incumbents. Rather than seeding fresh competitors via initial public offerings (IPOs), private equity increasingly provides building blocks that help publicly traded firms further consolidate their markets (Kwon et al. 2024).
Showing private equity’s increasing shadow ownership role, we find that private equity funds’ average duration for owning a given company has increased steadily over the last 40 years, suggesting that this is a long-term trend rather than solely a result of recent obstacles to profitable exits. Shadow ownership is also apparent in the growth of secondary buyouts in which buyout funds acquire companies from other buyout funds, thereby recycling companies within the private equity segment over extended periods or even indefinitely. While recent business commentary has framed these trends as evidence of funds’ inability to sell overvalued assets, we show how increased secondary buyouts and extended hold durations are longer-term trends that have developed across business cycles. We argue that they reflect a larger shift, in which private equity’s logic of ownership increasingly hinges on the ability to take advantage of regulatory and reporting exemptions for private companies.
Results: The Rise of the New Private Equity
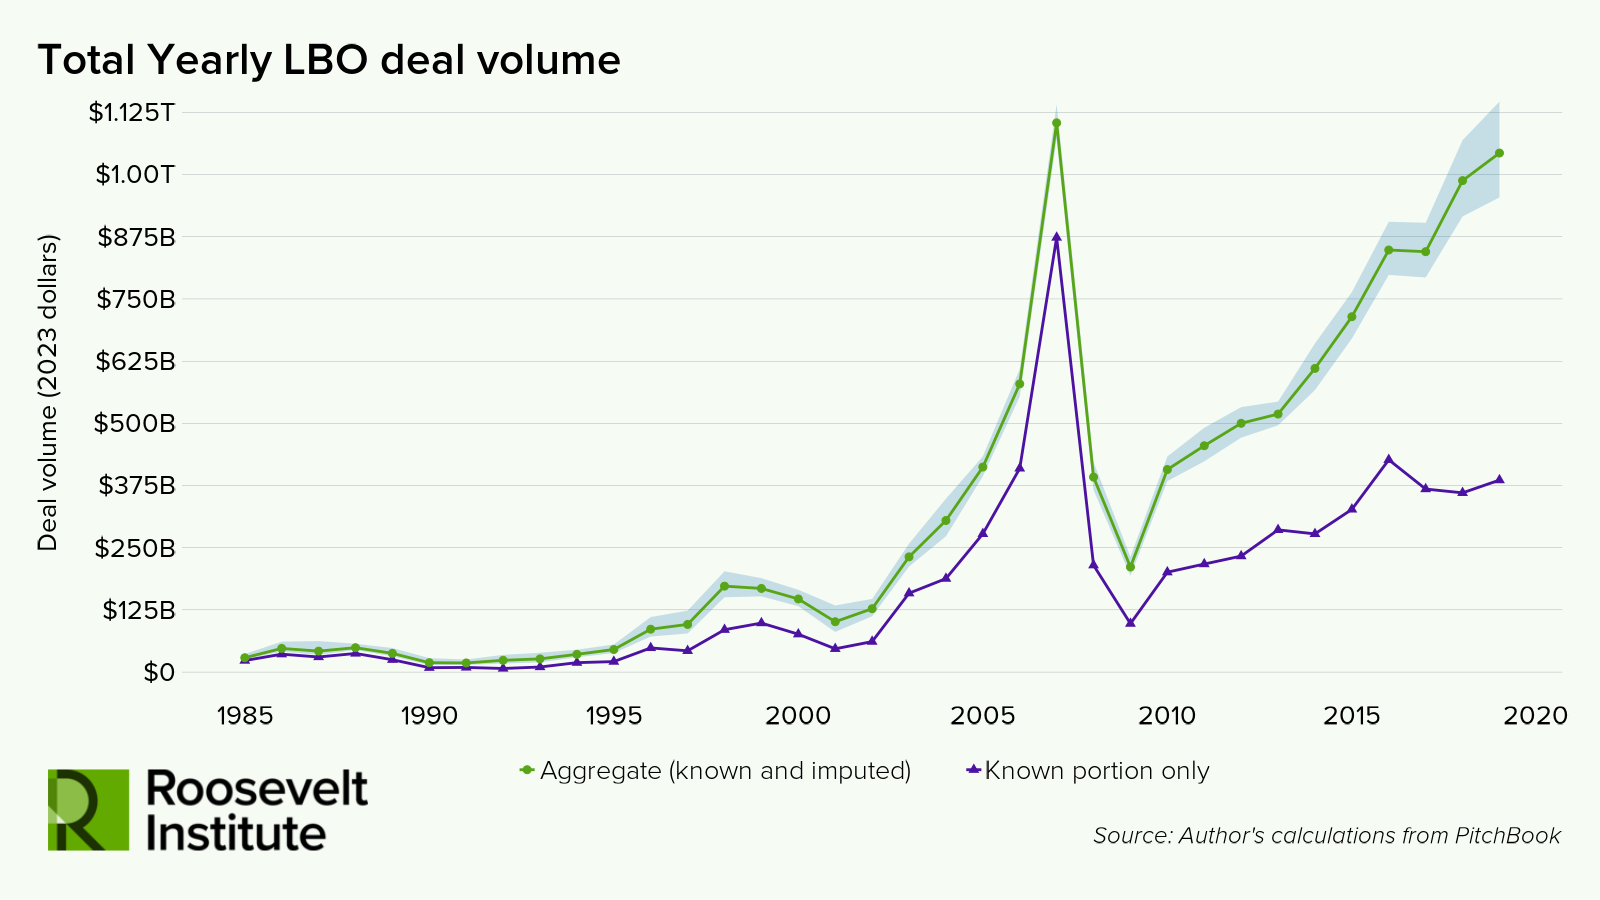
The core of our analysis below focuses on the relative balance between deal types by which the new private equity arose over the last four decades. First, however, Figure 1 contextualizes these analyses with estimates for total US buyout dollar volume. Consistent with Kaplan and Strömberg (2009), lines for both known and imputed dollar volume estimates show growth from the tens of billions in the early 1990s to the hundreds of billions in the 2000s, topping $1 trillion in 2007 and again in 2019. The imputed values increasingly diverge from naïve observed values after 2010, reflecting the increasing percentage of buyouts with undisclosed deal sizes. Although relying on imputation involves an unavoidable degree of uncertainty, our imputed estimates track with known growth rates of total private equity funds raised and buyout funds raised, as shown earlier. Additionally, the more rapid growth in imputed buyout volume after 2010 is plausible given the concurrent growth in the use of leverage for buyouts during this period (MacArthur 2020) and growth in buyout sponsorship by private equity portfolio firms rather than buyout funds themselves (see Appendix Figure A3).
Figure 1
Shifts Away from Corporate Raiding in Buyouts
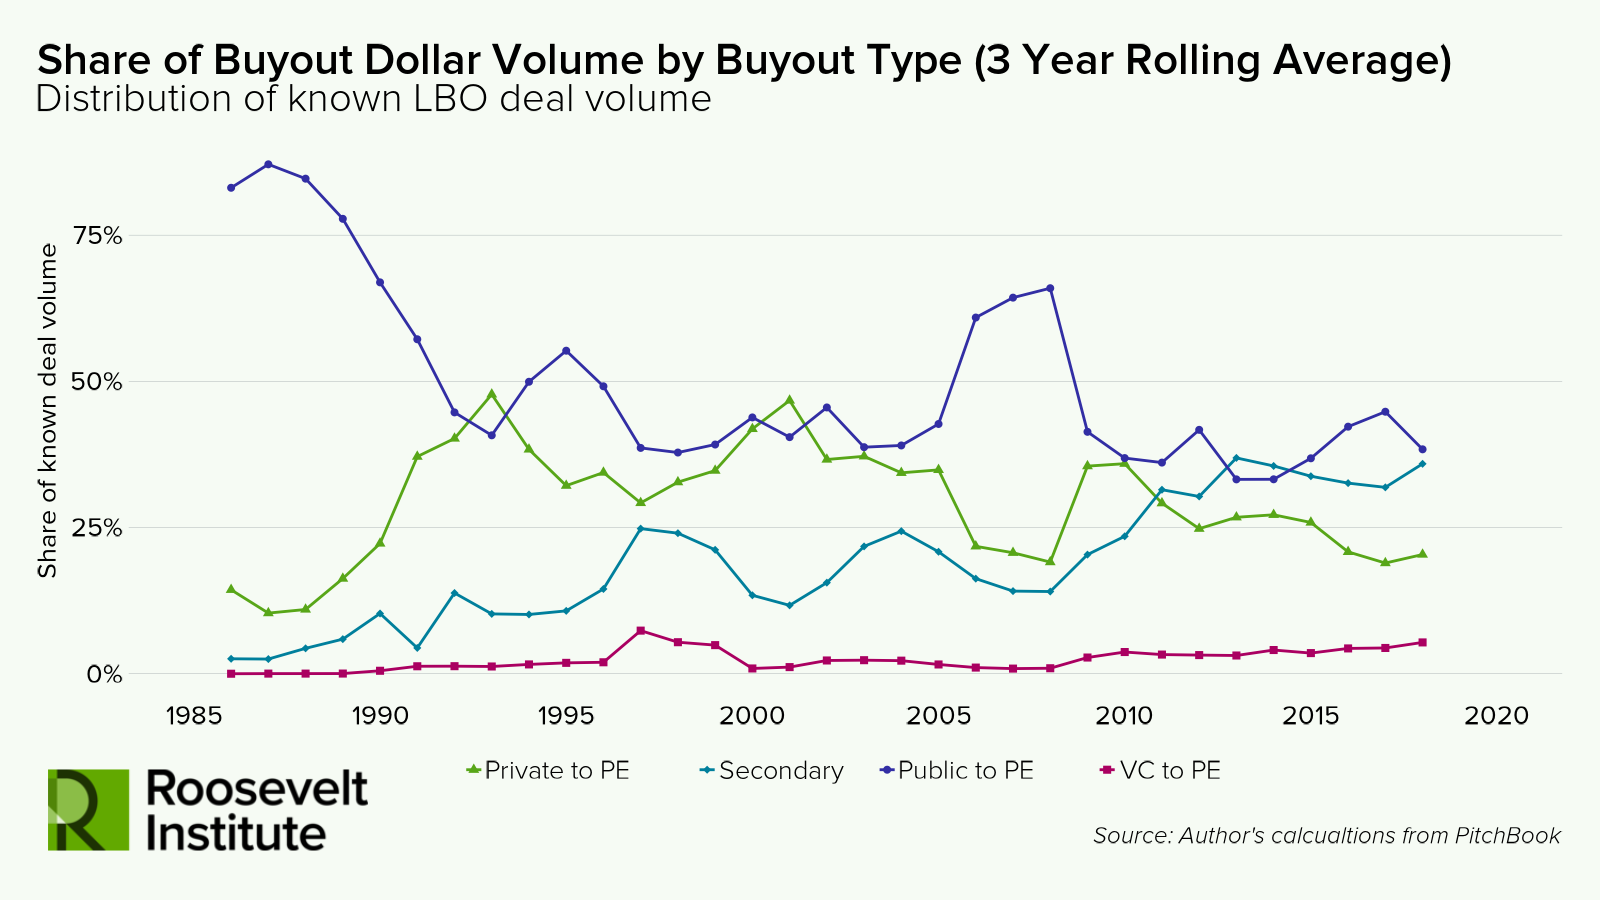
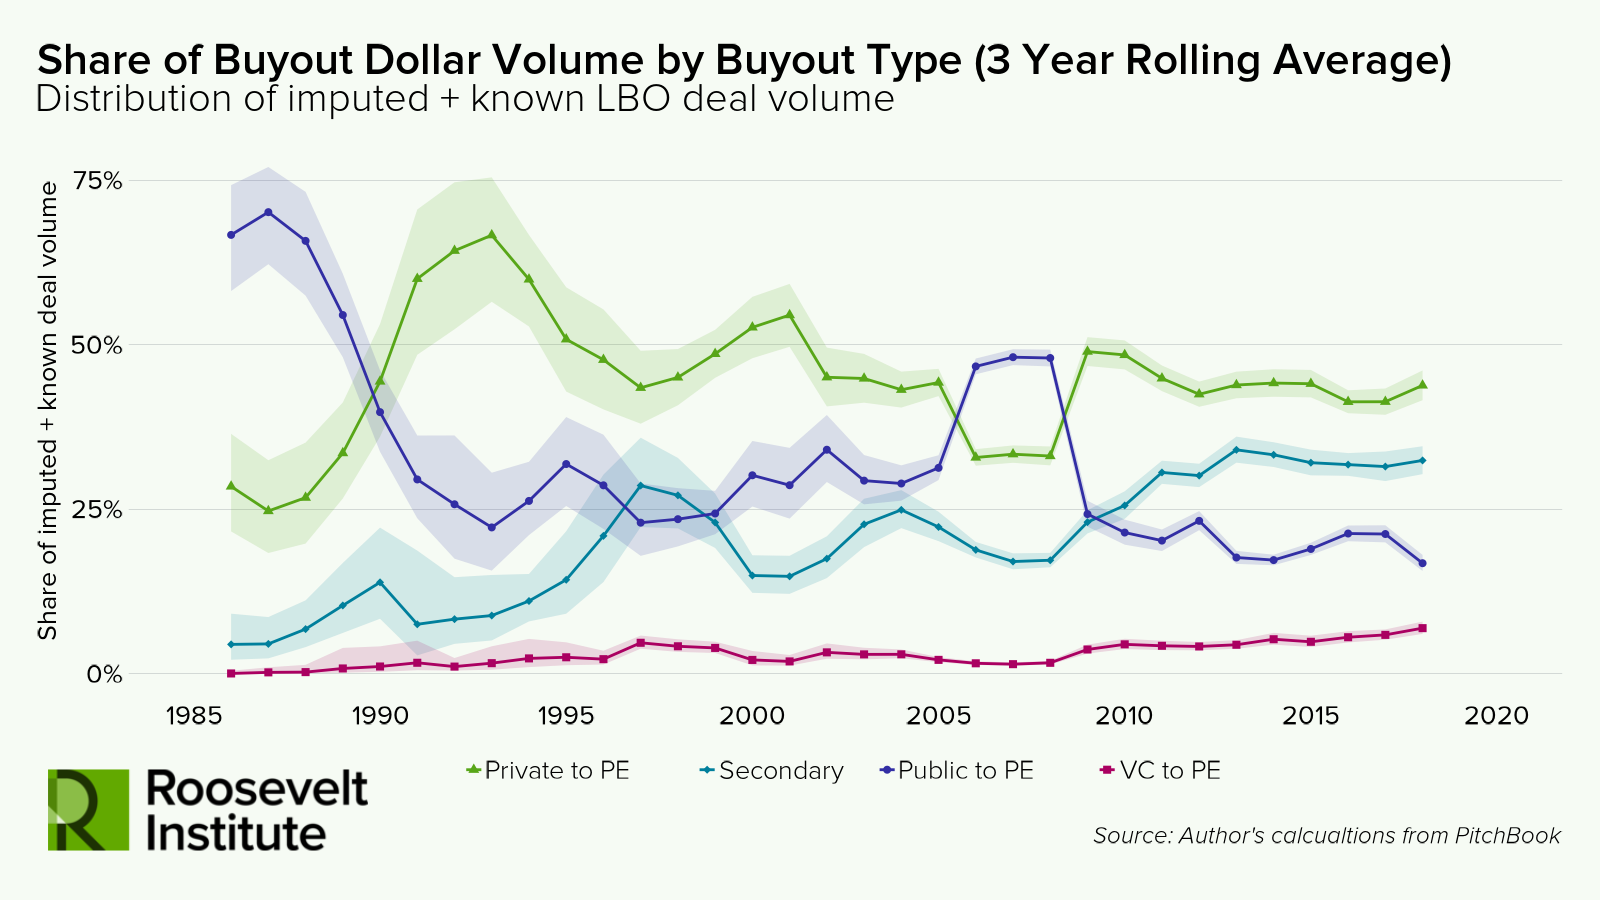
Figure 2 plots over time the proportions of total buyout dollar volume in the US that were (a) private-to-PE, (b) secondary, (c) public-to-PE, or (d) venture-to-PE. Represented by (a), (b), and (d), varieties of Main Street invading and shadow ownership grew to comprise a majority of buyout volume across this period. But after its peak in the 1980s, corporate raiding’s share declined from around 75 percent in the 1980s to a much lower fraction since the 1990s, though it briefly surged in the 2000s amid the low-interest rate capital glut of that period, before then collapsing during the 2008 financial crisis (Shivdasani and Wang 2011).
The top panel of Figure 2 uses known deal sizes only, excluding deals with imputed sizes. The bottom panel includes imputed values for missing deal sizes. While the estimates differ between the panels, both show the same structural trends over time, particularly in the decades before the 2008 financial crisis—years for which more than a third of deal sizes are known. The known deal-size panel shows a decline in public-to-PE buyouts from around 80 percent of dollar volume in the 1980s to around 40 to 55 percent for most of the 1990s, staying at around 40 percent throughout most of the 2000s and 2010s. The imputed deal size panel, which corrects for the disproportionate missingness of private-to-PE deal sizes, shows a similar but more precipitous decline from a peak of 70 percent of deal volume to around 20 percent in the 2010s.
Figure 2
The Rise of Main Street Invading and Shadow Ownership in Buyouts
Figure 2 also shows that volume during this period shifted particularly to private-to-PE deals, matching public buyouts in the known deal size panel and surpassing them in the imputed panel. These shifts show private equity rebalancing between corporate raiding and Main Street invading. Venture buyouts, another vehicle for Main Street invading, have expanded in more recent years, growing from 2 to 3 percent in the 2000s to 6 to 7 percent in recent years. This shift occurred mostly since 2010, when deal size missingness increases in our data. The trends are almost equivalent in the known deal size and imputed panels, reflecting that deal sizes are more commonly reported for venture buyouts. Similarly, the estimates are nearly equivalent across both panels for the growth of shadow ownership via secondary buyouts, which grew steadily to around 20 percent of deal volume at the end of the 2000s and surpassed 30 percent by 2018.
The Rise of Monopoly Building and Shadow Ownership in Buyouts
Analysis of add-on buyouts illustrates how private equity’s shadow ownership repertoire has facilitated monopoly building and declines in public reporting of buyout deal sizes.
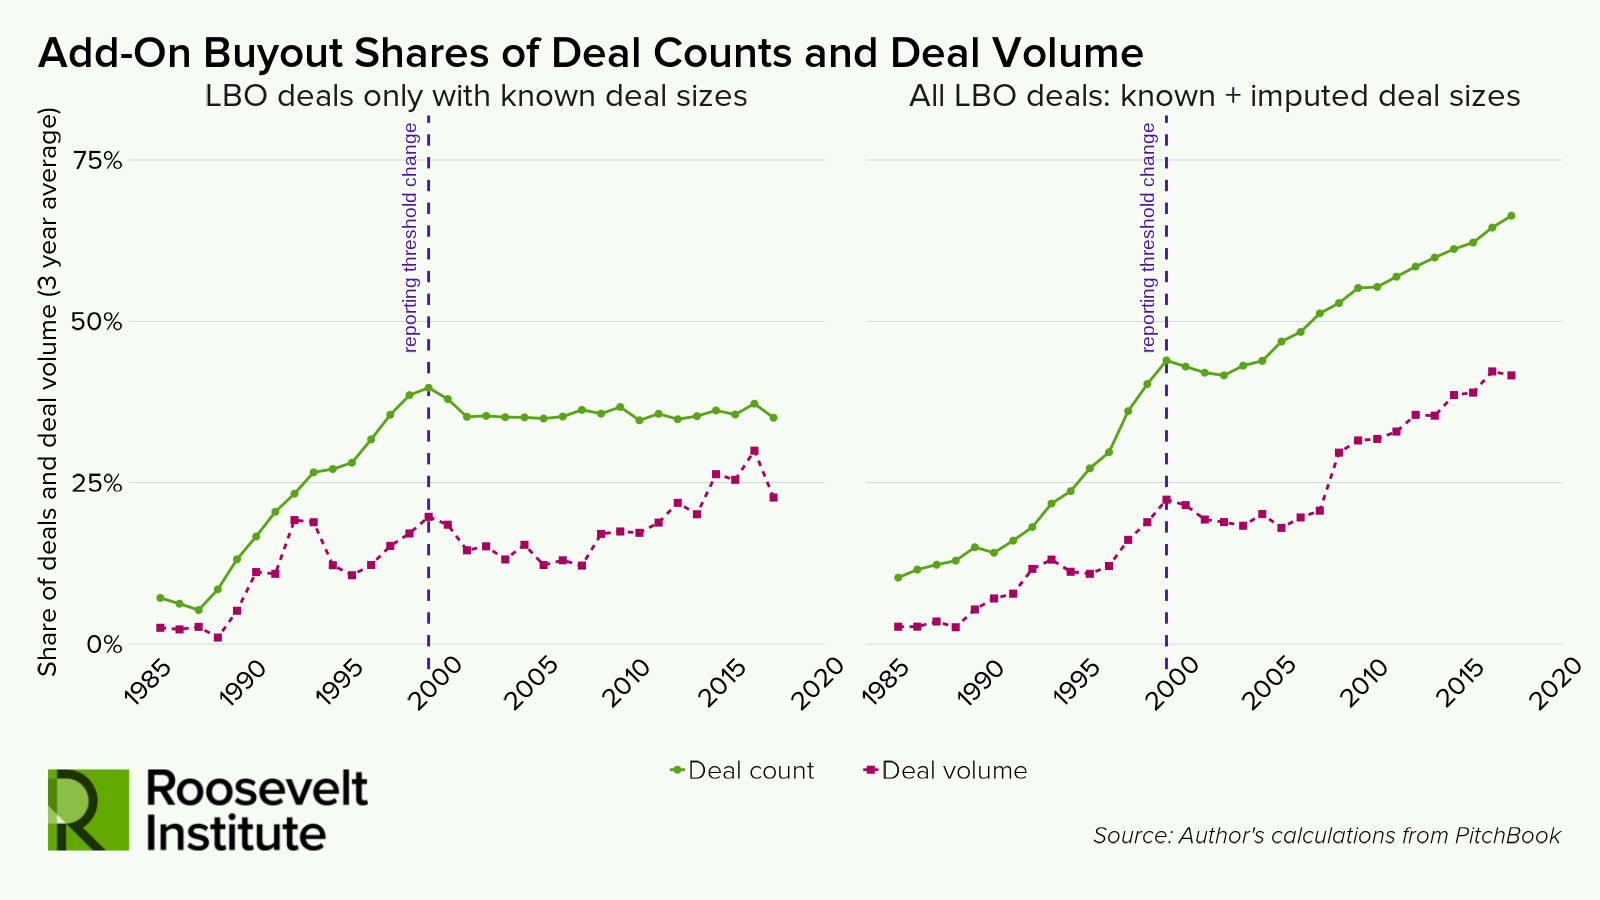
Figure 3 plots add-ons as a proportion of buyout deal counts and deal volumes, with separate panels for known deal size only (left) and including imputed deal sizes (right). Both plots show steady growth in add-ons as a share of deals from the 1980s to 2000, rising from a single-digit share to around 40 percent of all deals and around 20 percent of deal dollars. In 2000, the HSR antitrust reform increased the size threshold for add-on deal size reporting to the FTC. This stripped PitchBook and the business press of a reporting source for identifying deal sizes for large shares of private add-on buyouts and created an incentive for buyout funds to not publicly announce deal sizes below the threshold. As a result Appendix Table A3 shows that deal size reporting declined among private-to-PE and secondary deals from 2000 to 2019. Accordingly, the left-hand plot (showing only known sizes) shows a sharp decline and then flatlining of add-on buyouts as a share of all deals. The right-hand plot, however (additionally showing missing sizes), shows that add-on deals declined more modestly in the early 2000s and then resumed their growth to over 70 percent of all deals in 2018. Given the policy-associated drop in reports on add-on deal sizes, we place more confidence in our imputed estimate that add-on deal volume grew to over 40 percent of all deal volume in 2018.
Figure 3
Appendix Figure A4 shows that monopoly building add-on buyouts have also grown in conjunction with Main Street invading. Our imputed estimates show that add-ons have grown to comprise a majority of private-to-PE buyout deal dollar volumes and nearly 50 percent of venture-to-PE buyouts.
Monopoly Building and Shadow Ownership: Evidence from Exits
Analysis of deal exit data further highlights the increasing centrality of monopoly building and shadow ownership roles. Figure 4 plots the share of buyout exits by known exit type for LBO deals occurring between 1985 and 2020.3 Three key patterns are apparent. First, Figure 4 highlights a collapse in private equity’s prior role in creating publicly traded challengers to publicly traded incumbents through IPOs. IPOs fell from 20 to 25 percent of exits in the 1980s to less than 2 percent of exits in 2020, with most of the decline occurring by the end of the 1990s. This is again consistent with the timing of new regulatory advantages for continued private ownership created by the 1996 amendment of the Investment Company Act, and the tightening of public corporation regulations by Sarbanes-Oxley in 2002.
Figure 4
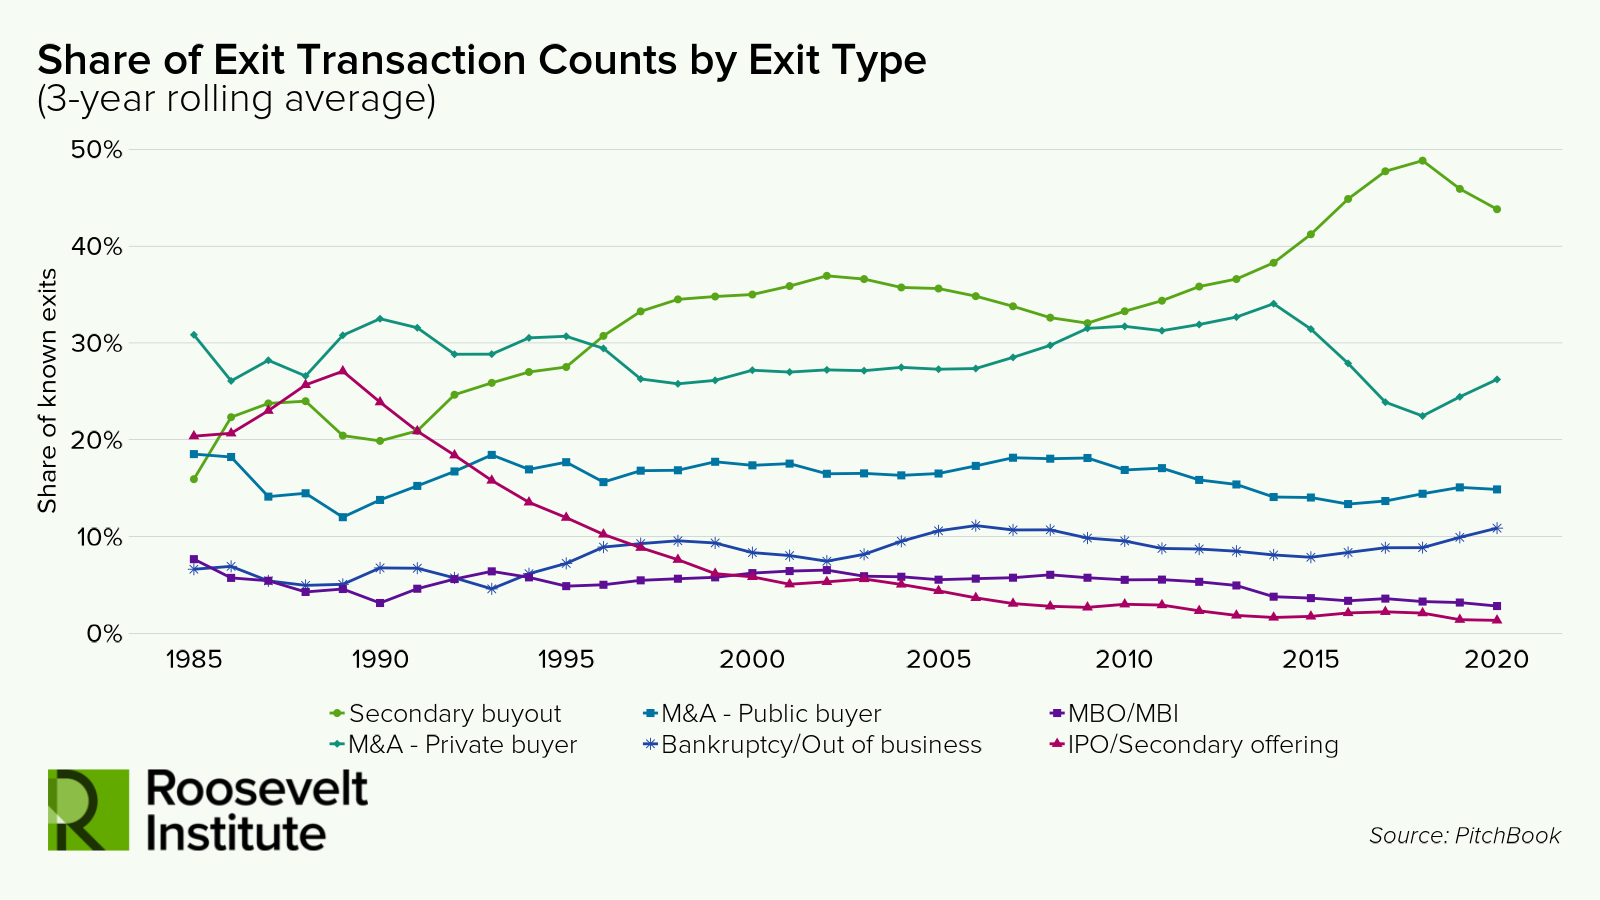
Second, the prevalence of secondary exits grew from approximately 20 percent in the 1980s to around 35 percent in the 2000s. Secondaries grew further to nearly 50 percent of all exits in 2015–2020. This means that private equity funds’ deal exits increasingly serve to recycle portfolio companies back into the PE system, which is consistent with the permanent shadow owner role.
Finally, Figure 4 highlights how private equity has maintained a long-standing role in monopoly building through mergers and acquisitions (M&A) exit sales to other nonfinancial firms (both publicly traded and private). Across all years shown in Figure 4, M&A sales to privately held firms made up around 30 percent of all exit deals. By comparison, M&A sales to public firms made up slightly more than 15 percent of all exit deals in most years. Combined, M&A exits to private and public firms made up nearly half of all exits in most years, but around two-thirds of these M&A exits involved private firm buyers.
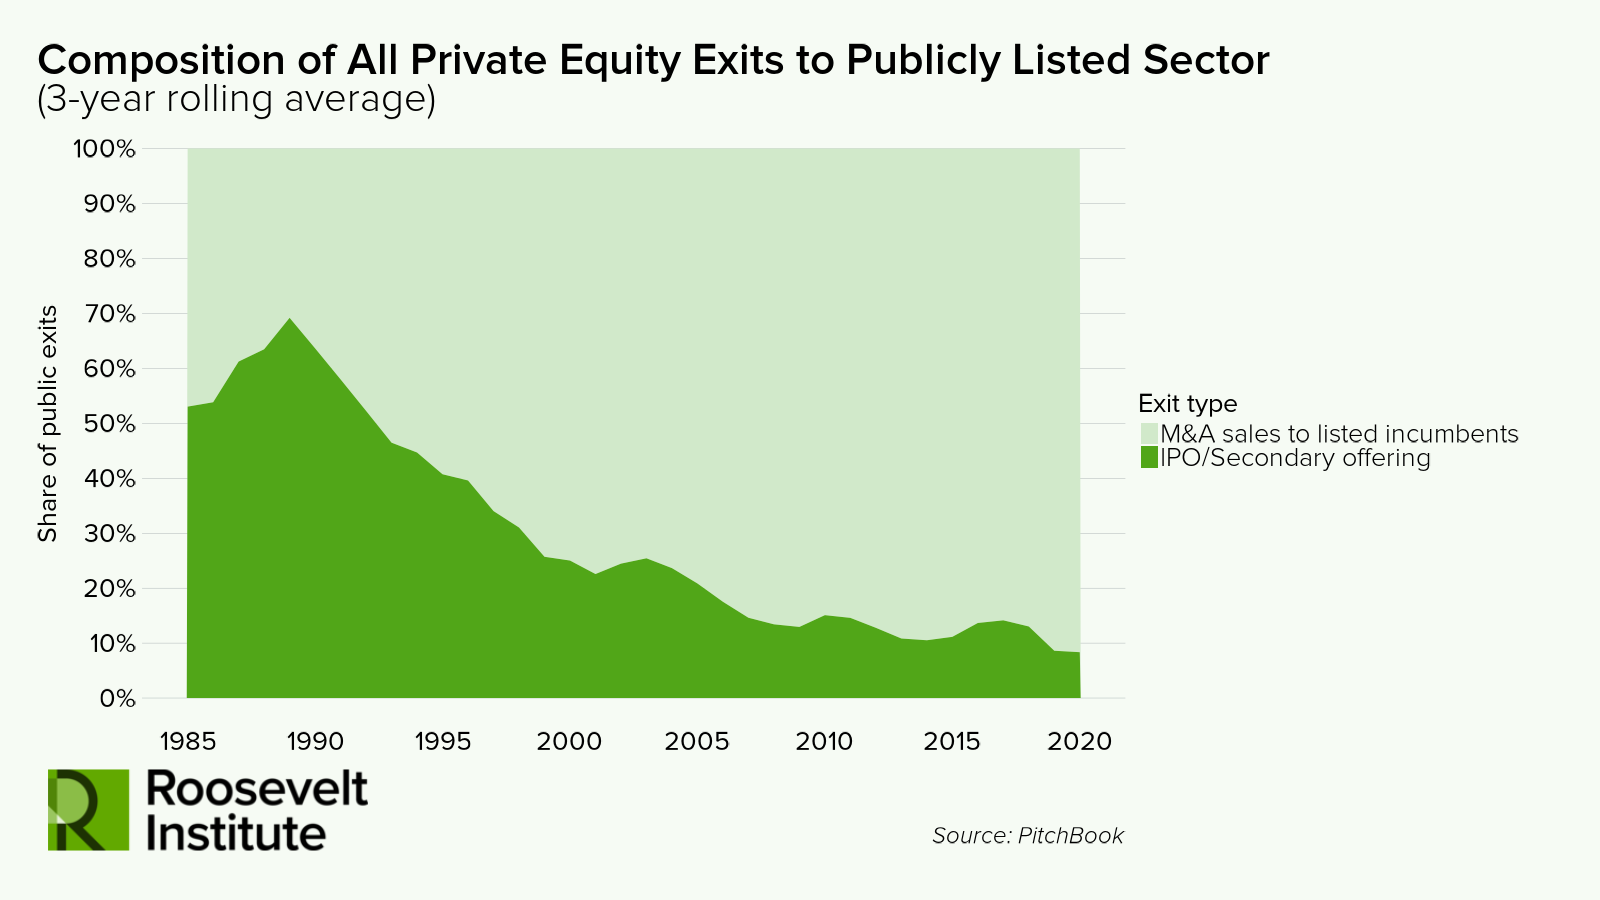
If a private equity portfolio firm does eventually move into public ownership, it is usually through acquisition by a publicly traded competitor, not through an IPO. We illustrate this in Figure 5, which plots the composition of all exits to the publicly listed sector over time. In the 1980s, over 60 percent of exits to the publicly listed sector were through IPOs. In recent years, over 90 percent of exits to the publicly listed sector have been through M&A sales to public firms. Through this inversion of private equity’s relationship to publicly held firms, private equity now not only builds its own monopoly-pursuing firms but also provides raw material for publicly traded firms to engage in monopoly-building. Overall, the patterns in Figures 4 and 5 suggest that private equity has increasingly assumed the role Jensen (1989) predicted as a permanent private market for corporate control. That market, however, serves to increase corporate concentration rather than create investor-owned challengers to incumbents.
Figure 5
Shadow Ownership: Evidence from Hold Times
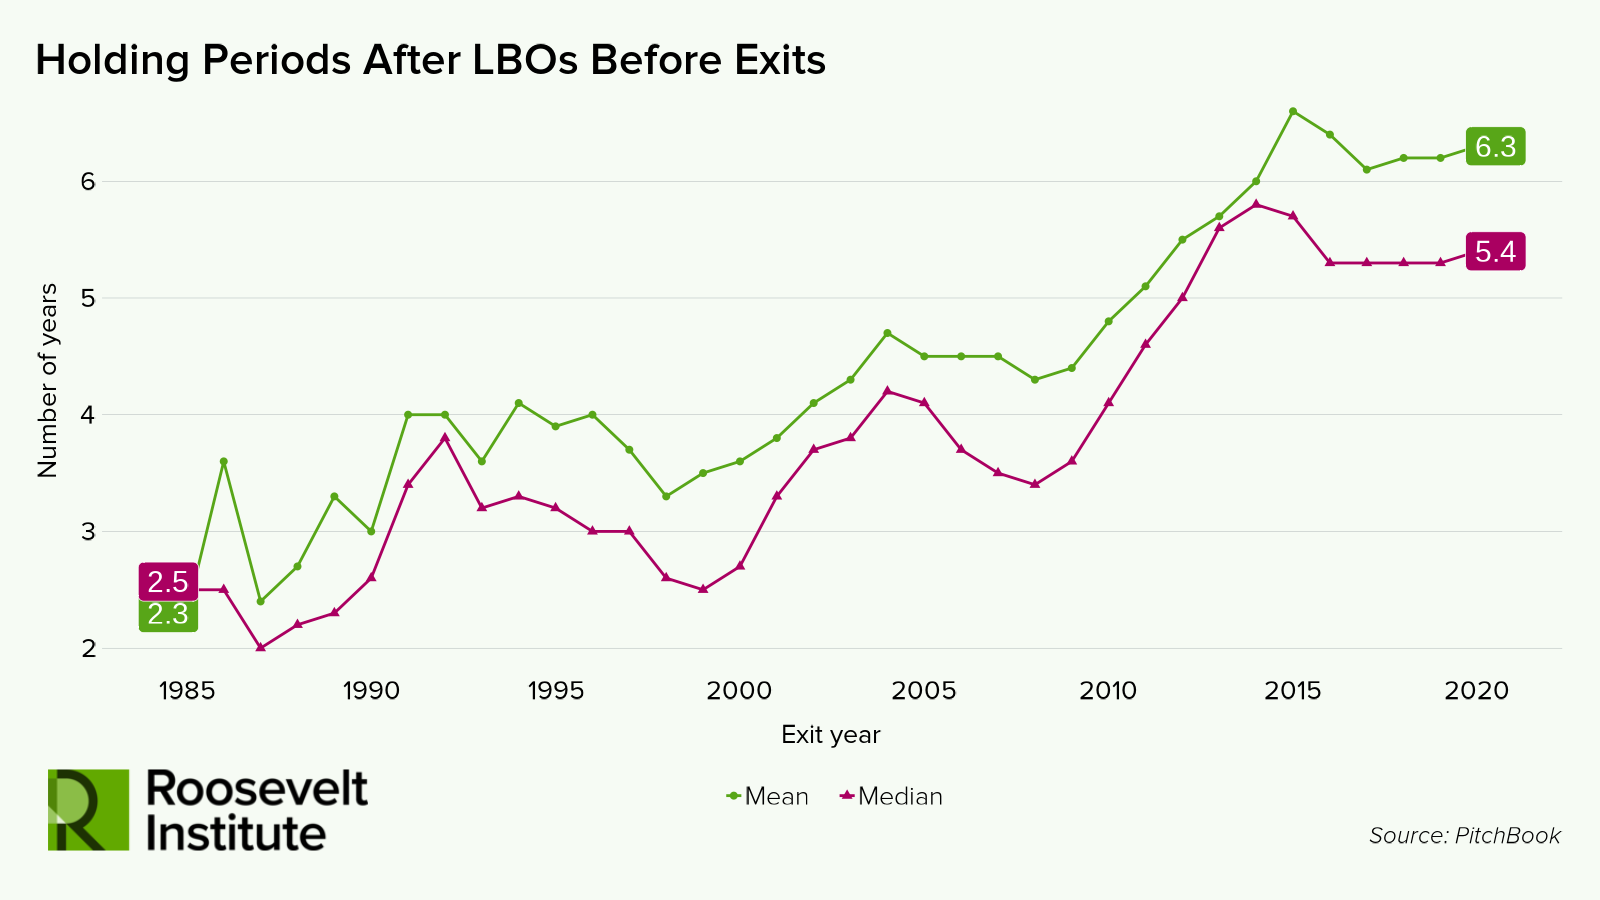
Longer investment hold time offers another indicator of the rise of the shadow ownership model. Figure 6 shows that average hold times increased from around 2.5 years in the 1980s to 6 years in 2020. Our measure defines hold time as the period in which a portfolio firm is owned by a given PE fund following a buyout, whereas some prior studies consider the total duration that portfolio firms are held by any PE fund or private owner (Strömberg 2008). The fact that hold times have increased steadily over the last 40 years suggests that this is a long-term trend rather than solely the product of recent obstacles to profitable exits. Longer holds also fit with a decline in corporate raiding, as scaling companies through monopoly building or other buy-and-build strategies likely takes longer than the management restructuring or financial reengineering traditionally employed by corporate raiders.
Figure 6
Monopoly Building: PE and Overall US Merger and Acquisition Activity
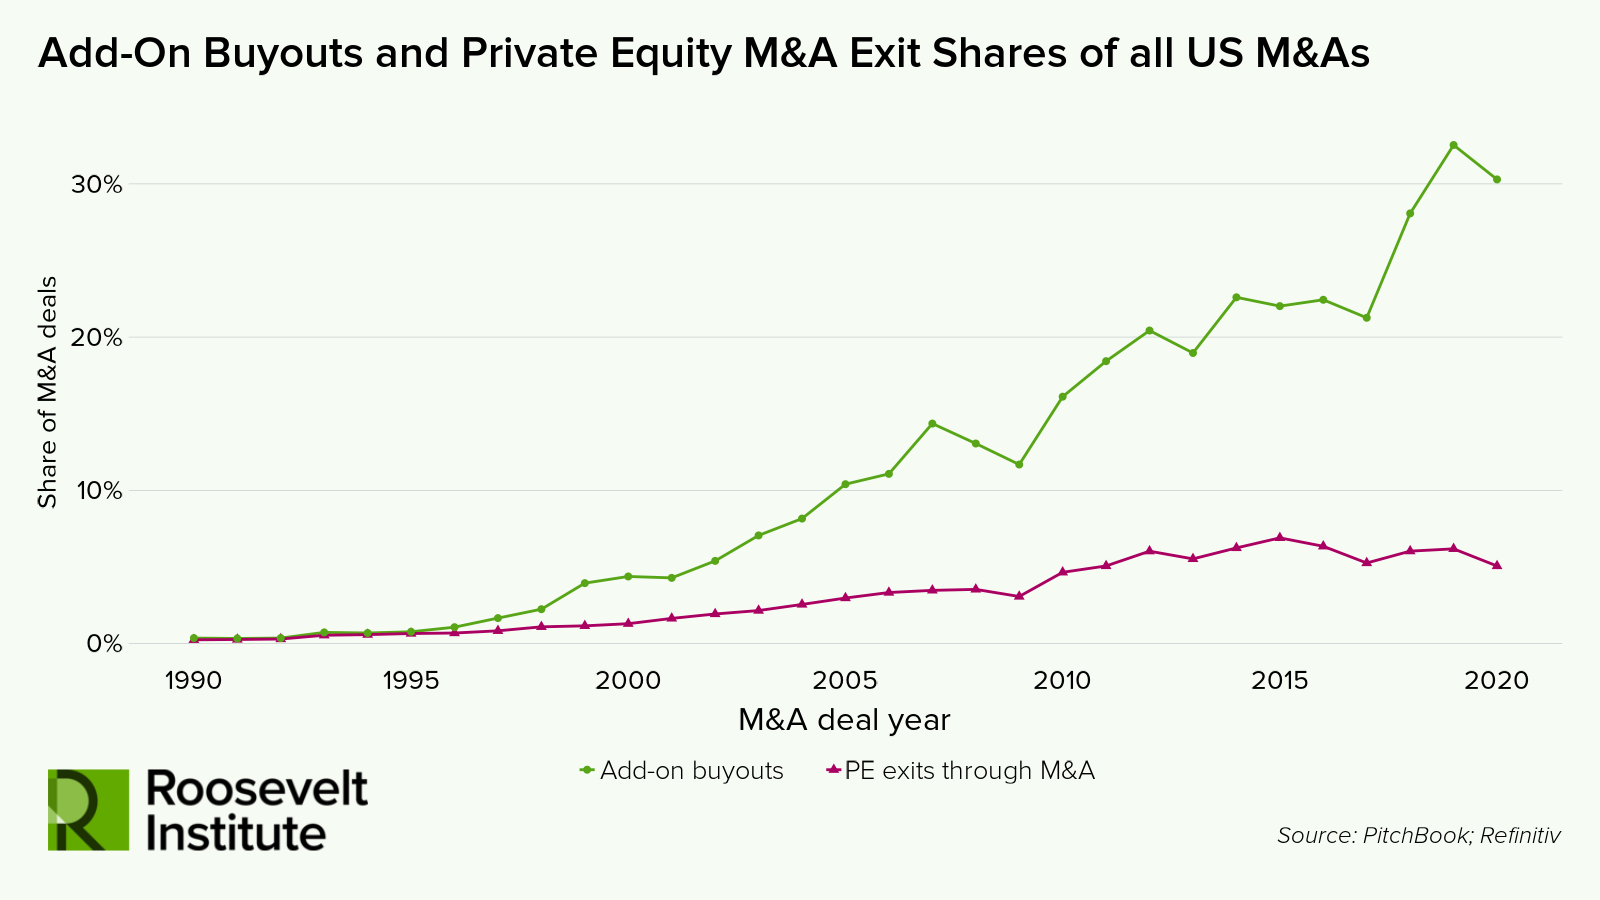
In a final assessment of private equity’s monopoly-building role, we find that private equity add-on buyouts and M&A exits account for a growing share of all US mergers and acquisitions activity. Figure 7 shows these trends. Here the denominator is all US M&A deals, including M&A deals not involving private equity. On the acquisition side of M&A transactions, the green line shows that add-on buyouts grew from just over 0 percent of M&A deals in the 1990s to approximately a third in recent years. On the selling side, the magenta line shows that private equity exits through M&A sales grew from less than 1 percent of M&A deals to over 5 percent in the last decade.
Figure 7
Footnotes
- The remainder of business net worth is held under noncorporate private ownership that is common to millions of small businesses. ↩︎
- The last such estimates were published more than 15 years ago (Kaplan and Strömberg 2009). ↩︎
- Here we focus on the proportion of exit deals rather than the proportion of deal dollar volume, as exit deal size data is too sparse for analysis or reliable imputation. ↩︎
Acknowledgments
The authors are grateful for the Roosevelt Institute’s generous support for this research. They are also thankful to Neil Fligstein, Armando Lara-Millan, Kimberly Kay Hoang, Ken-Hou Lin, and participants in the Berkeley Economy and Society convening and Politics, Culture, and Markets conference for their feedback on this project. This working paper is equal authored. Authors are listed in alphabetical order. Any errors, omissions, or other inaccuracies are the authors’ alone.
Suggested Citation
Eaton, Charlie, Albina Gibadullina, Adam Goldstein, and Marie-Lou Laprise. 2026. “The New Private Equity: Corporate Raider, Main Street Invader, Monopoly Builder, Shadow Owner,” Roosevelt Institute, October 22.
RELATED RESOURCES
Authors



Adam Goldstein
Guest AuthorAdam Goldstein is an associate professor in sociology at the School of Public and International Affairs at Princeton University.