

Who’s Minding the Kids These Days?: An Analysis of Children’s Care Arrangements
May 7, 2026
By Sarah Jane Glynn

Key Takeaways
- The Decline of the “Traditional” Single-Earner Household: Only a quarter of American families now fit the outdated stereotype of a working father and stay-at-home mother.
- The Stress of the “Patchwork” System: Because the current system is unaffordable and in short supply, millions of families rely on an exhausting “patchwork” of formal and informal care from relatives and multiple nonrelative arrangements. Nearly half of children under age five experiences multiple care settings, a source of significant stress and a clear indicator of a “broken” care infrastructure.
- Telework Is Not a Childcare Solution: The report highlights a significant, lasting increase in parents simultaneously working and caregiving since the 2020 pandemic. This new normal is often a forced survival strategy due to a lack of affordable center-based options, rather than a sustainable long-term model for working families.
- Childcare Is Essential Economic Infrastructure: Childcare is not just a personal choice but a crucial component of the nation’s economic infrastructure. Stable, accessible care is the engine that allows parents to maintain employment and supports the overall stability of the economy.
- A Need for Data-Driven Investment: To fix the “long-standing cracks in the nation’s care infrastructure,” there is an urgent need for data-driven childcare policies and significantly greater public investment. Aligning care availability with the actual hours and demands of the 21st-century workday is essential for family economic security.
Introduction
The United States is home to 62.4 million parents1 raising 72.7 million children.2 In addition to their roles as caregivers, the majority of parents are also paid workers.3 Childcare has never been more important—to employers, to the economy, and most certainly to parents. But relatively little is known about the care arrangements used by millions of families each week. Where do millions of young children go when their parents head off to work, and how stable is the care infrastructure our economy depends on?
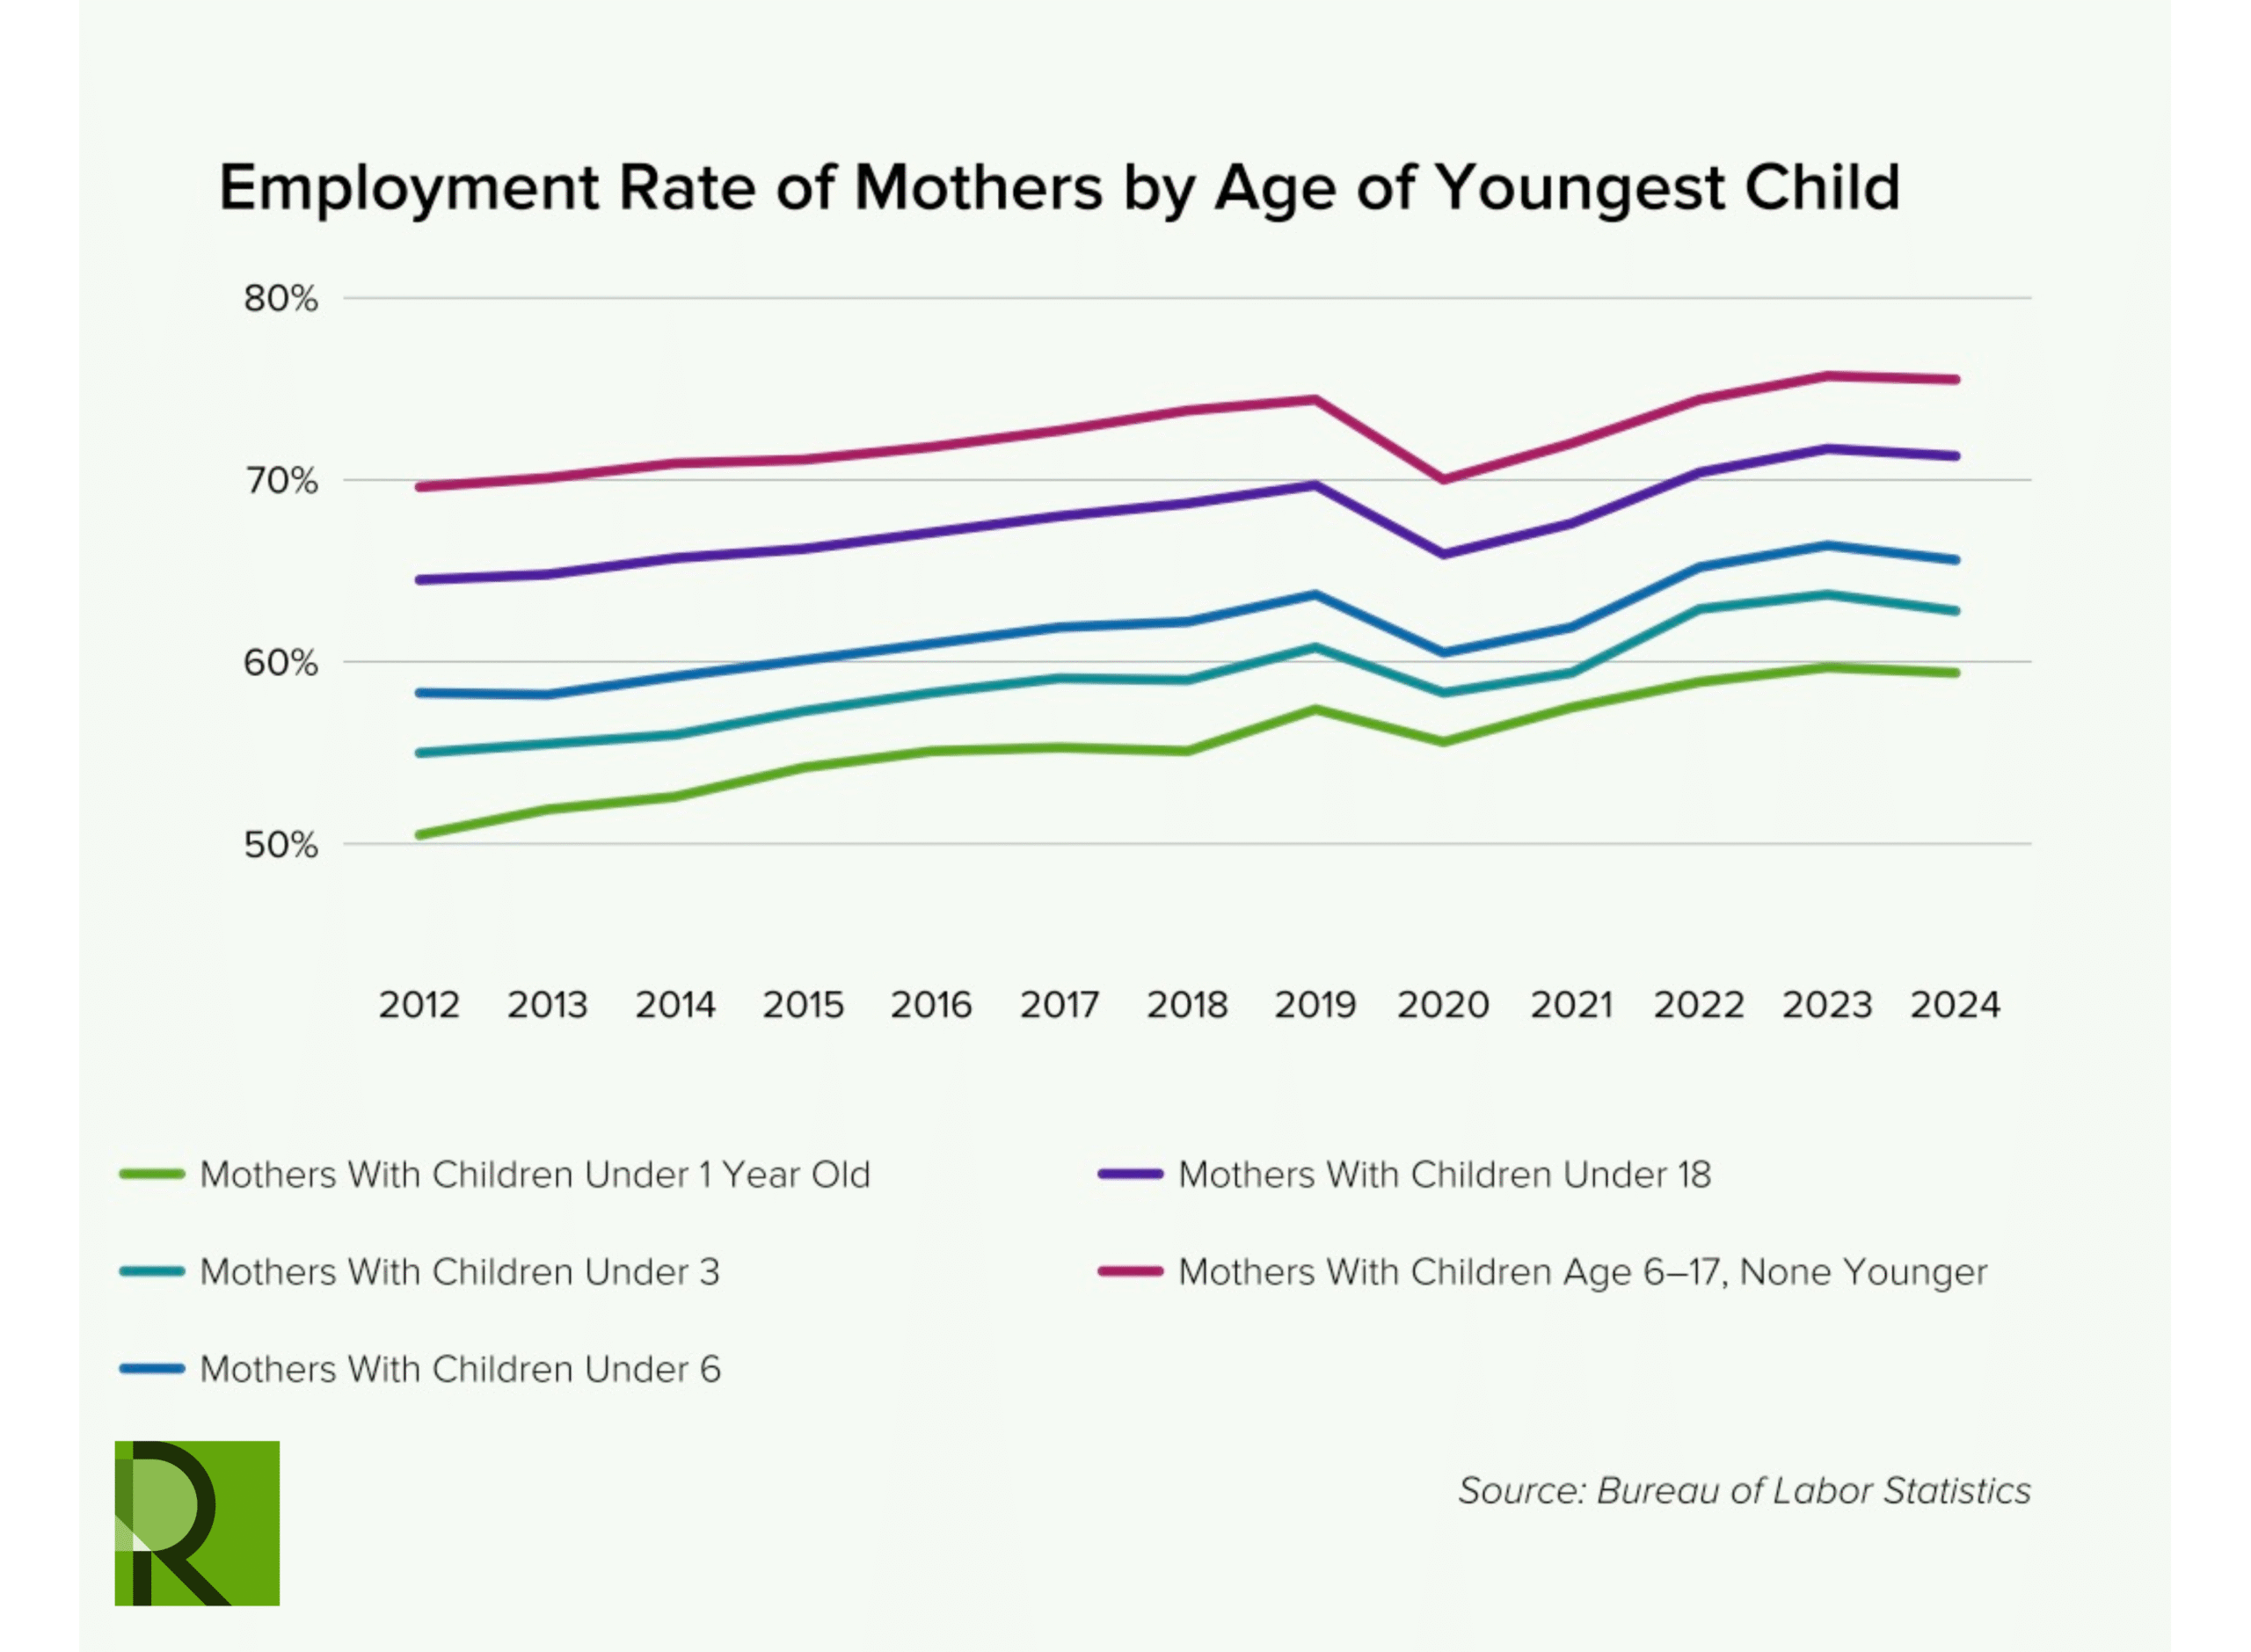
In 2025, parents with children at home made up 30.4 percent of all workers, and 12.5 percent of workers were parents with a child under age six.4 Fathers are more likely to participate in the labor force than mothers, but most mothers work, a pattern that has been in place for decades.5 Although maternal labor force participation rates differ by age of the youngest child, race, ethnicity, and marital status, in 2024 the majority of mothers were in the labor force, even among the groups historically least likely to work.6
Figure 1
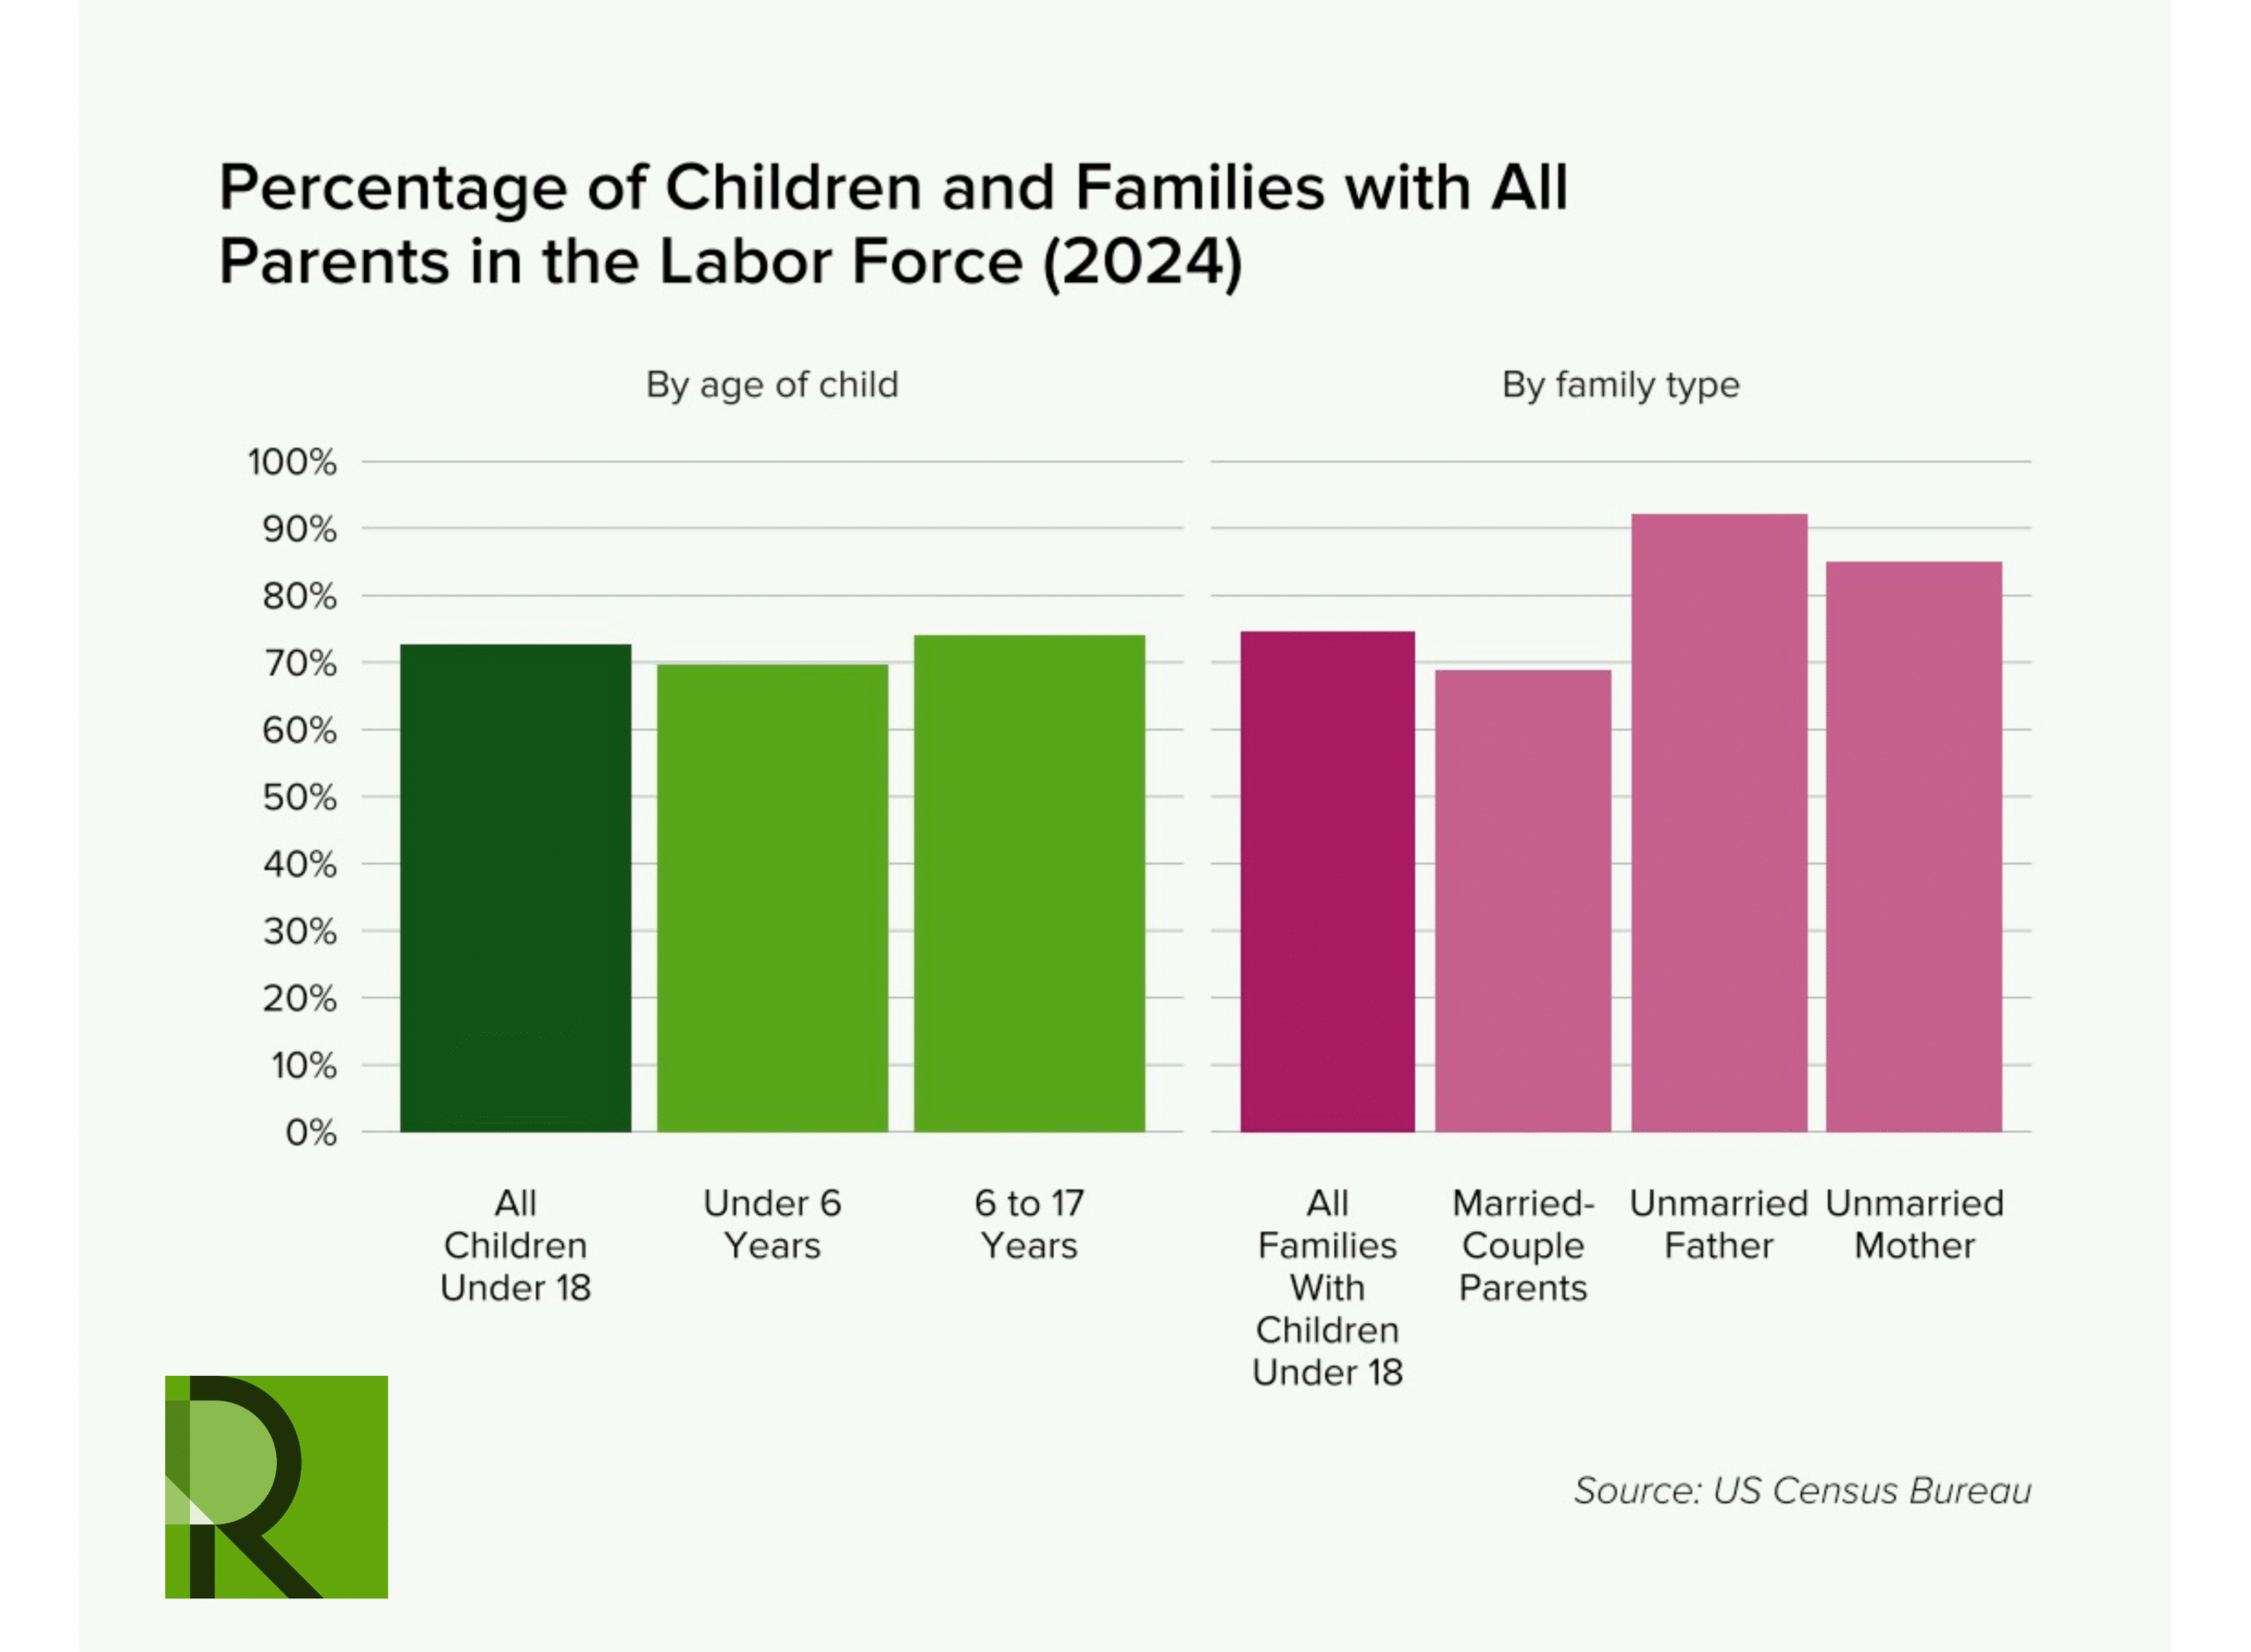
The same pattern holds true when looking at parents and children from different angles: In the majority of families, all of the parents living in the household work,7 and most children live with parents who all work.8 In other words, the stereotypical family where the father works and the mother stays home to provide full-time care only applies to one-quarter of all families.9
Figure 2
Given that most parents work and most children do not have a full-time stay-at-home parent, ensuring care for children during working hours is vitally important. This was demonstrated clearly during the COVID-19 pandemic, when schools moved instruction online and childcare became more difficult to access.10 Access to care is a crucial component of the economy and the nation’s infrastructure. Stable, accessible childcare allows working parents to maintain employment and ensures that children, particularly the youngest who cannot be safely or legally left alone, have their needs met.11
Schools are an important component of care for children, since, in addition to providing education and enrichment, they offer crucial supervision during the majority of the typical workday. But many children are too young for school; in all but a few states children must be at least five years old before starting public school, and even then the majority of states do not require school districts to offer full-day kindergarten programs.12 Longer school hours are required for older children, but most schools in the United States are not in session year-round, and the school day is shorter than the average workday for most.13 This means that when parents are unavailable due to work or other obligations, they must personally find solutions to keep their children safe and supervised, outside of simply relying on the school system.
Access to care is a crucial component of the economy and the nation’s infrastructure.
Childcare—be it paid or unpaid, in-home or at a facility, provided by family or by paid professionals—matters tremendously to parents, to communities, and to the economy. But care is in short supply, is difficult to access, and is too expensive for most families to afford. The system is, by many measures, broken.14 Childcare is a significant source of stress for parents, and surveys show worrying connections between the difficulty of accessing care and negative mental health outcomes.15 Parents themselves are certainly well aware of the challenges they face finding, paying for, and maintaining childcare arrangements. Yet despite its importance and the urgent need for improvements and greater investment, relatively little is known about the childcare arrangements used by families.
Data
Information about the types of care families rely on is sparse because few nationally representative datasets include this information. The National Database of Childcare Prices provides geographically detailed information about market-rate prices for different types of care but does not include data on how many families use them.16 The National Survey of Early Care and Education includes a household survey with questions about the types of care families use, but the most current available data was collected in 2019, prior to the COVID-19 pandemic.17
The Survey of Income and Program Participation (SIPP) is a longitudinal survey collected annually and includes detailed information on childcare arrangements for children under 15. The US Census Bureau periodically issued reports on childcare arrangements using SIPP childcare data beginning in the 1980s, but the most recent version was published more than a decade ago using data collected in 2011.18
Understanding current childcare usage patterns is important to addressing a range of public policy issues, from employment to education to child and parental health and well-being. This brief provides an updated overview of the types of childcare arrangements used by families based on data from the 2024 Survey of Income and Program Participation. The 2024 SIPP contains information about childcare usage in the fall of 2023, the most recent data available at the time of publication.
Some of the categories used for analysis are the same as those used in previously published census reports. However, because of changes to the survey, the results in this brief are not comparable to data collected prior to 2019.19
A Note on the SIPP
The SIPP asks childcare questions of respondents who are parents with at least one child under the age of 15.20 Information is collected separately about each child in the household, but the questions are only asked of the “reference parent.” If both parents live in the home, the reference parent is the mother by default. In single-parent families, the parent living with the child(ren) is the reference parent, and most single-parent families are headed by women.21 As a result, the majority of childcare data is collected from mothers, who are the parents most likely to be responsible for primary caregiving and care arrangements.
Beginning in 2019, the SIPP asked about families’ childcare use during a typical week in the previous fall, which could be up to 11 months before the survey interview. In most cases, reference parents were asked if they used different types of care when they were working, in school, or otherwise not with their child. Questions about whether the child was cared for by the reference parent or by the other parent or stepparent were only asked of times when the reference parent was working or in school, and questions about whether the child cared for themself were only asked of times when the reference parent was not with them.
Findings
Children’s Age
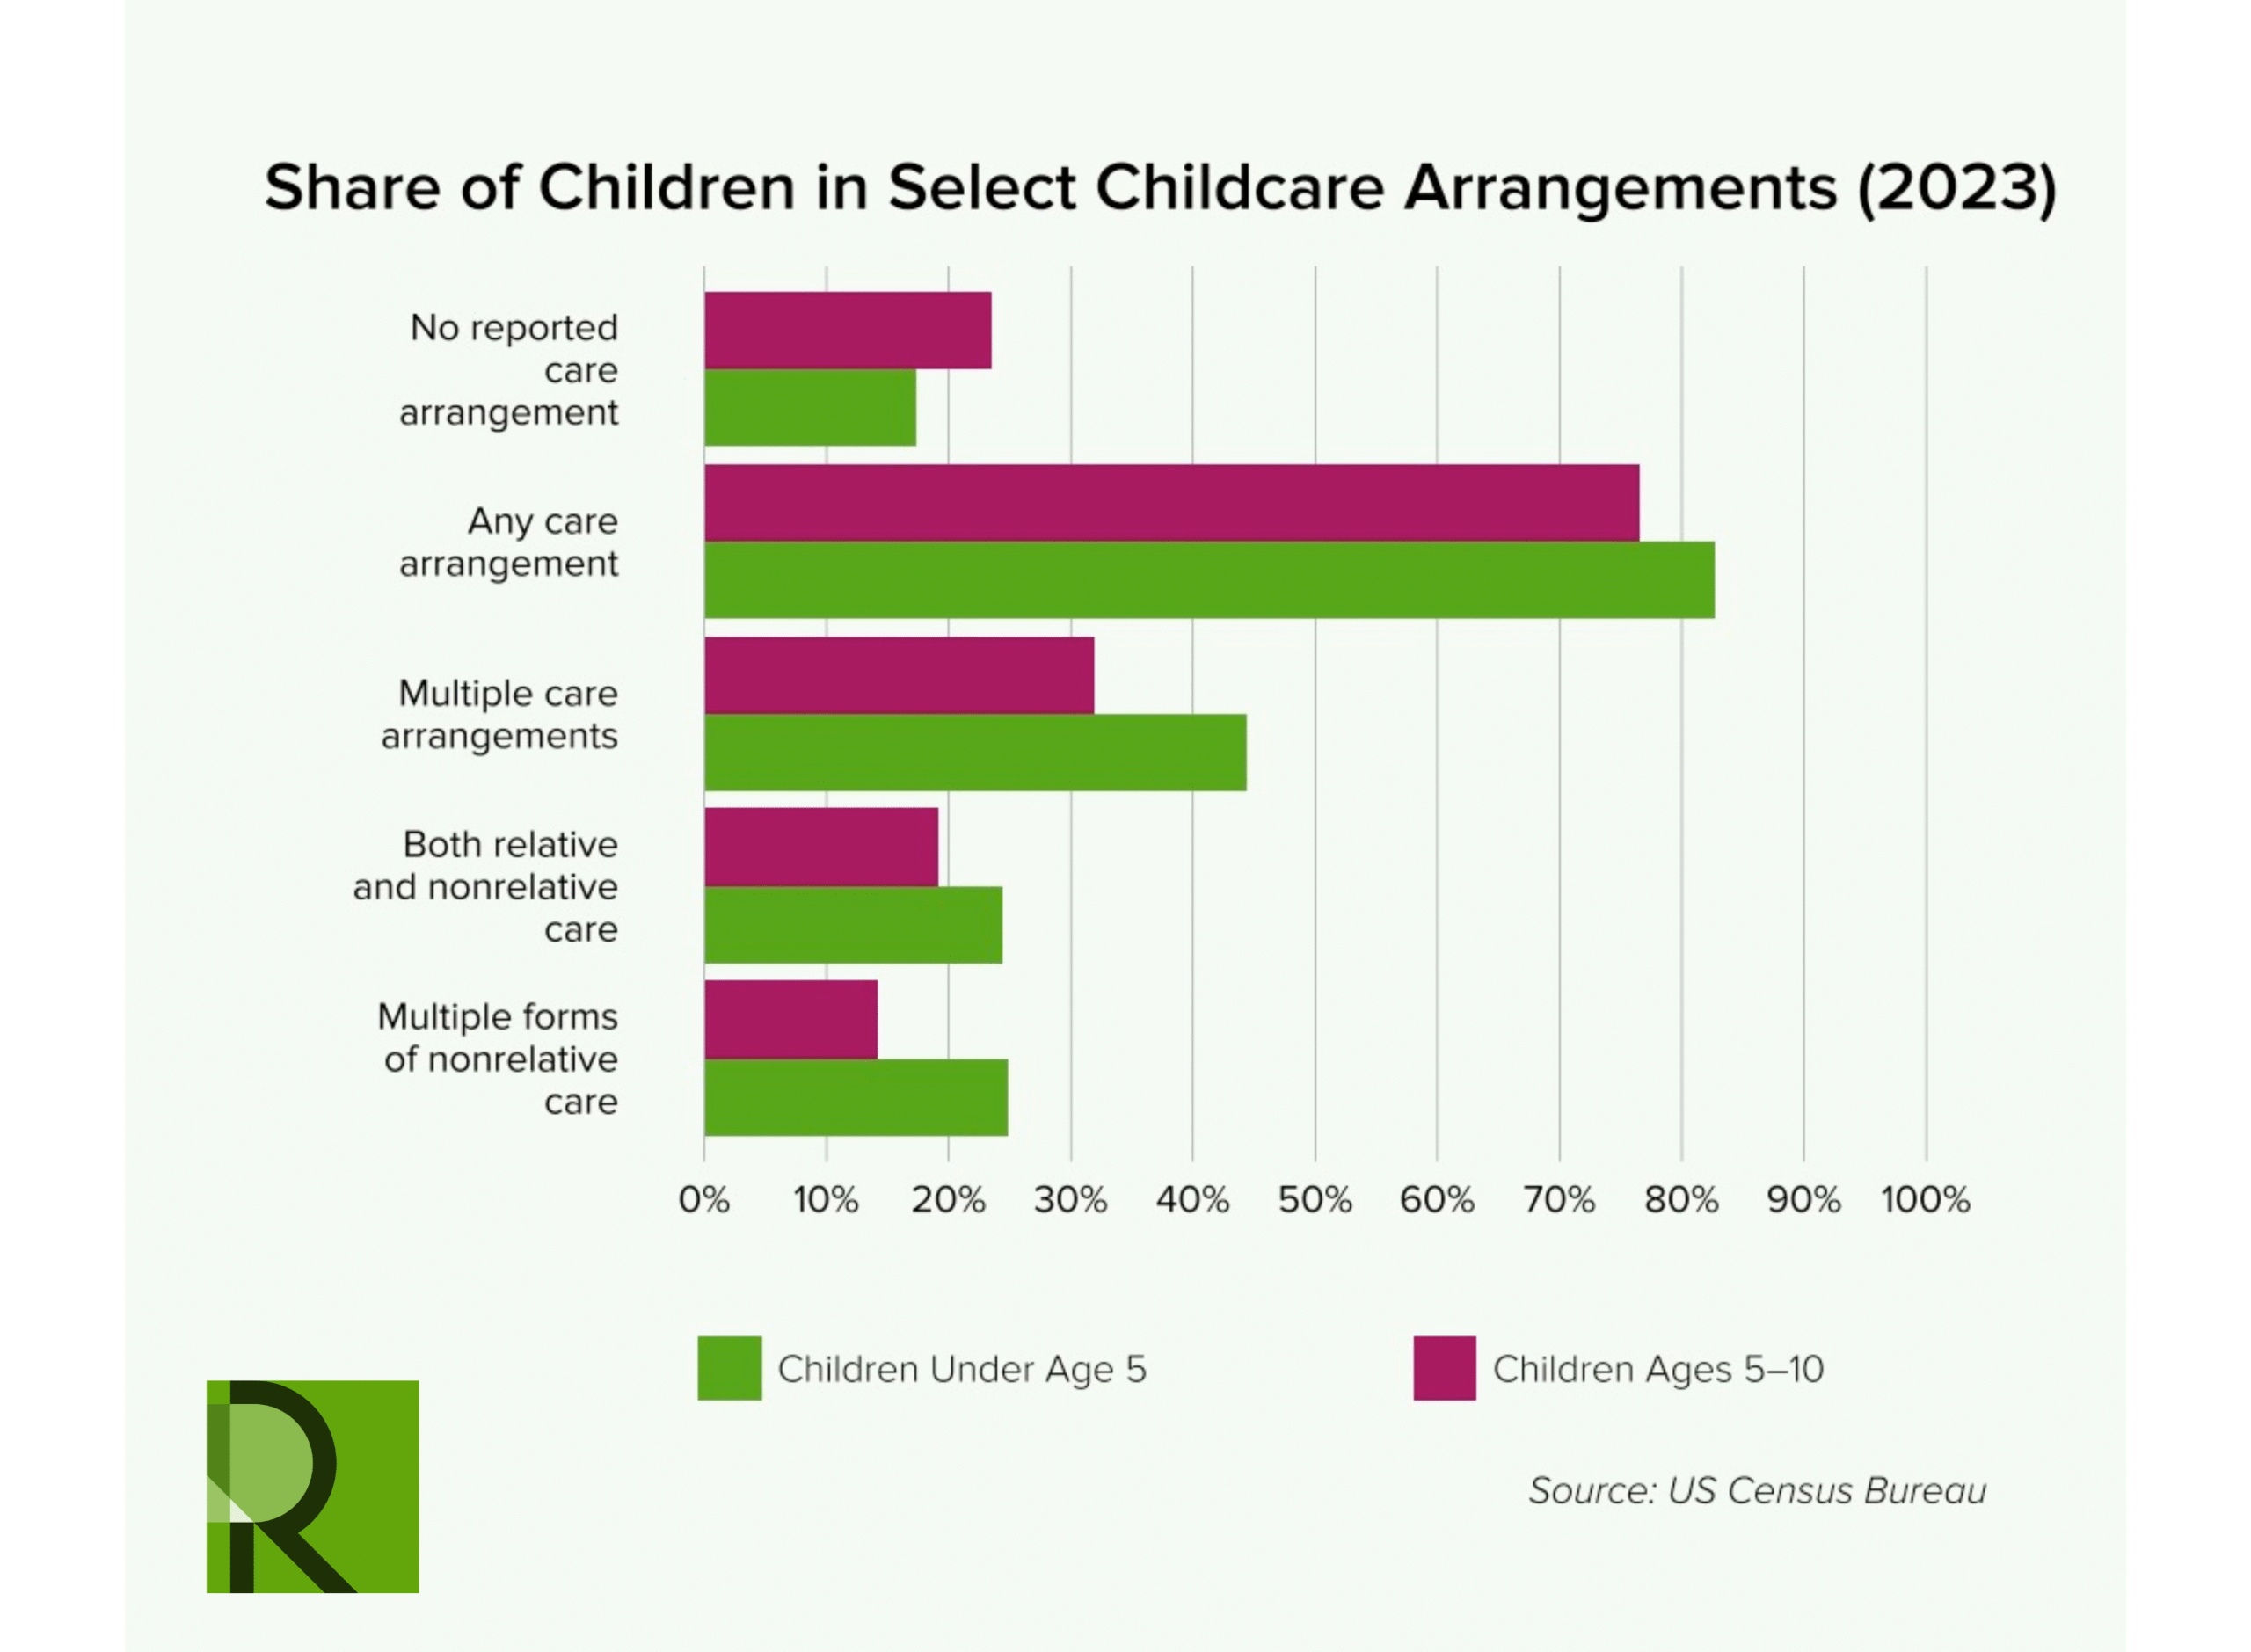
A significant majority of children are in care arrangements of some type, with even higher rates among those who have not yet reached school age. An estimated 15.3 million children under the age of 5 were in at least one form of care while their parents were working or in school (82.7 percent), along with 18.5 million older children (76.5 percent) between the ages of 5 and 10 (see Figure 3).
Figure 3
Overall, childcare that is provided by a relative—such as a parent, older sibling, or grandparent—is more common than nonrelative care. In the fall of 2023, more than two-thirds of children under age five (69.9 percent) received care from a relative when their mother or reference parent was busy, while nearly half (47.6 percent) received some form of nonrelative care, such as attending daycare or preschool (see Table 1 in Appendix). Elementary school–aged children—those ages 5 to 10—were just as likely as younger children to be cared for by relatives (67.8 percent).22 While family care rates were largely the same, older children were much less likely to be cared for by a nonrelative. For most children in this age group, it is highly likely that formal schooling takes the place of other forms of care during weekdays when their parents are at work or are otherwise busy. (Because SIPP data specifically asks about childcare arrangements used in the fall, when school is in session, it is unfortunately not possible to use this data to measure what happens during summer breaks.)
Families’ greater reliance on relative care could be due to a number of causes. Some parents rely on other family members to care for children when they are working because that is their preference; some would always choose family care over other options. Depending on personal circumstances, care provided by relatives may be easier to arrange, like an aunt who steps in to do daycare pickup when parents have to work late. Childcare is unaffordable for most families, and relative care is typically less expensive—and potentially even free. Teenagers watching their younger siblings after school may or may not be compensated for their labor, but in nearly all instances their prices are lower than those charged by formal care providers.
Figure 4
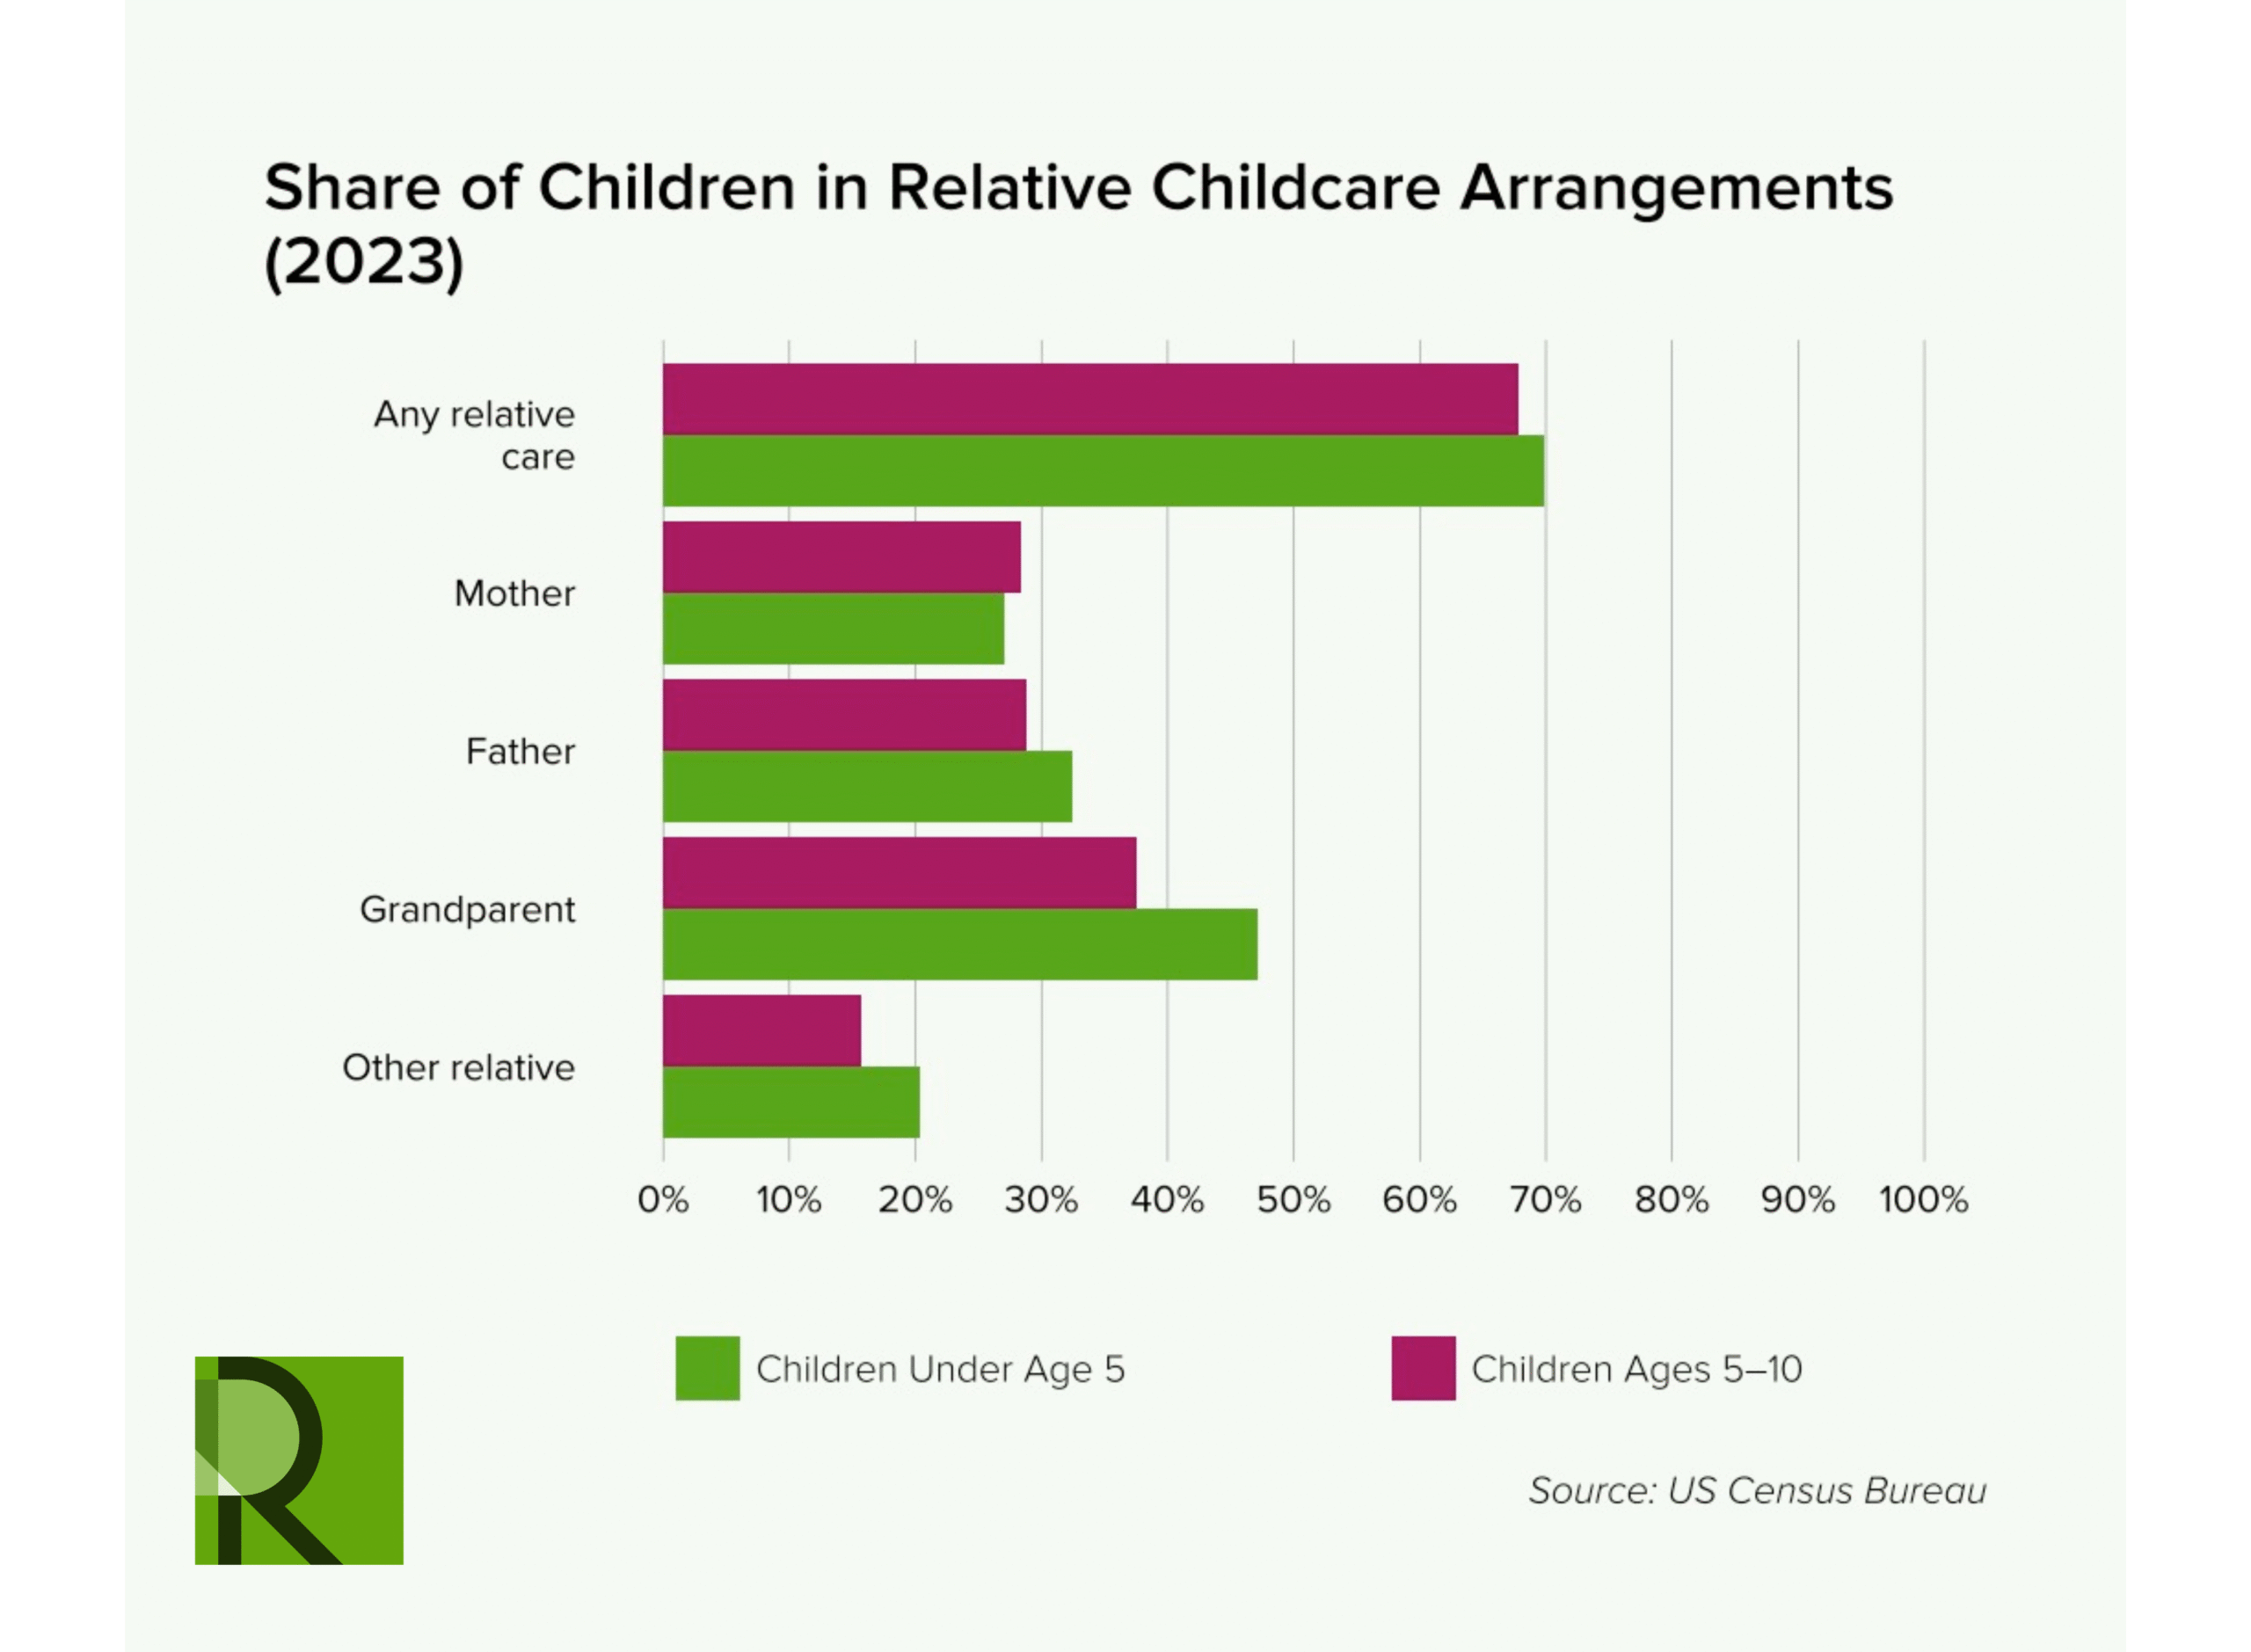
In 2023, more than one in four children were cared for by a parent who was simultaneously busy with work or school, a significantly higher proportion than in 2018. The percentages of children receiving relative care overall, grandparent care, or care from a sibling or another relative did not change meaningfully from 2018 to 2023. However, the share of children being cared for by mothers and fathers substantially increased in 2020 and has remained elevated since. This suggests that the effects of the 2020 pandemic continued to have a meaningful effect on parental care in 2023, possibly due to the increased availability of telework.23 (See Appendix for more comparisons of selected childcare arrangements pre- and post-pandemic.)
Regardless of the child’s age, grandparent care was the most common care arrangement, though school-aged children were significantly less likely than younger children to be watched by a grandparent. Roughly half of children under age 5 were cared for by a grandparent (47.2 percent), a rate nearly 10 percentage points higher than for children ages 5 to 10 (37.5 percent). Grandparent care can be a source of joy for children and grandparents alike, and in families where grandparents live nearby, are healthy, and are not working, this can be the first choice among possible arrangements. Grandparents who live in the same household can be especially convenient sources of care, and the fact that they provide childcare does not necessarily mean they are the primary source. But, as with other sources of relative care, in many families these decisions are influenced more by high prices and a lack of other available options than any of the adults’ preferences. Unlike parental care, grandparent care has not significantly increased over time; the percentage of children who were cared for by a grandparent was not significantly different in 2023 than it was before 2020. However, children were less likely to be cared for by a grandparent in 2020, possibly because of older people’s greater health risks from COVID-19.
Though nonrelative care is much more common among preschoolers than older children, it is still an important aspect of care for school-aged children, particularly in times outside of the school day, like evenings or weekends.24 Overall, more than three-quarters of children who are in nonrelative care arrangements attend some form of center-based care, such as a preschool, daycare center, or after-school program. As might be expected based on their ages, younger children were more likely to attend daycare centers, nurseries, or preschools, while elementary school–aged children were more likely to attend before- or after-school programs.
Figure 5
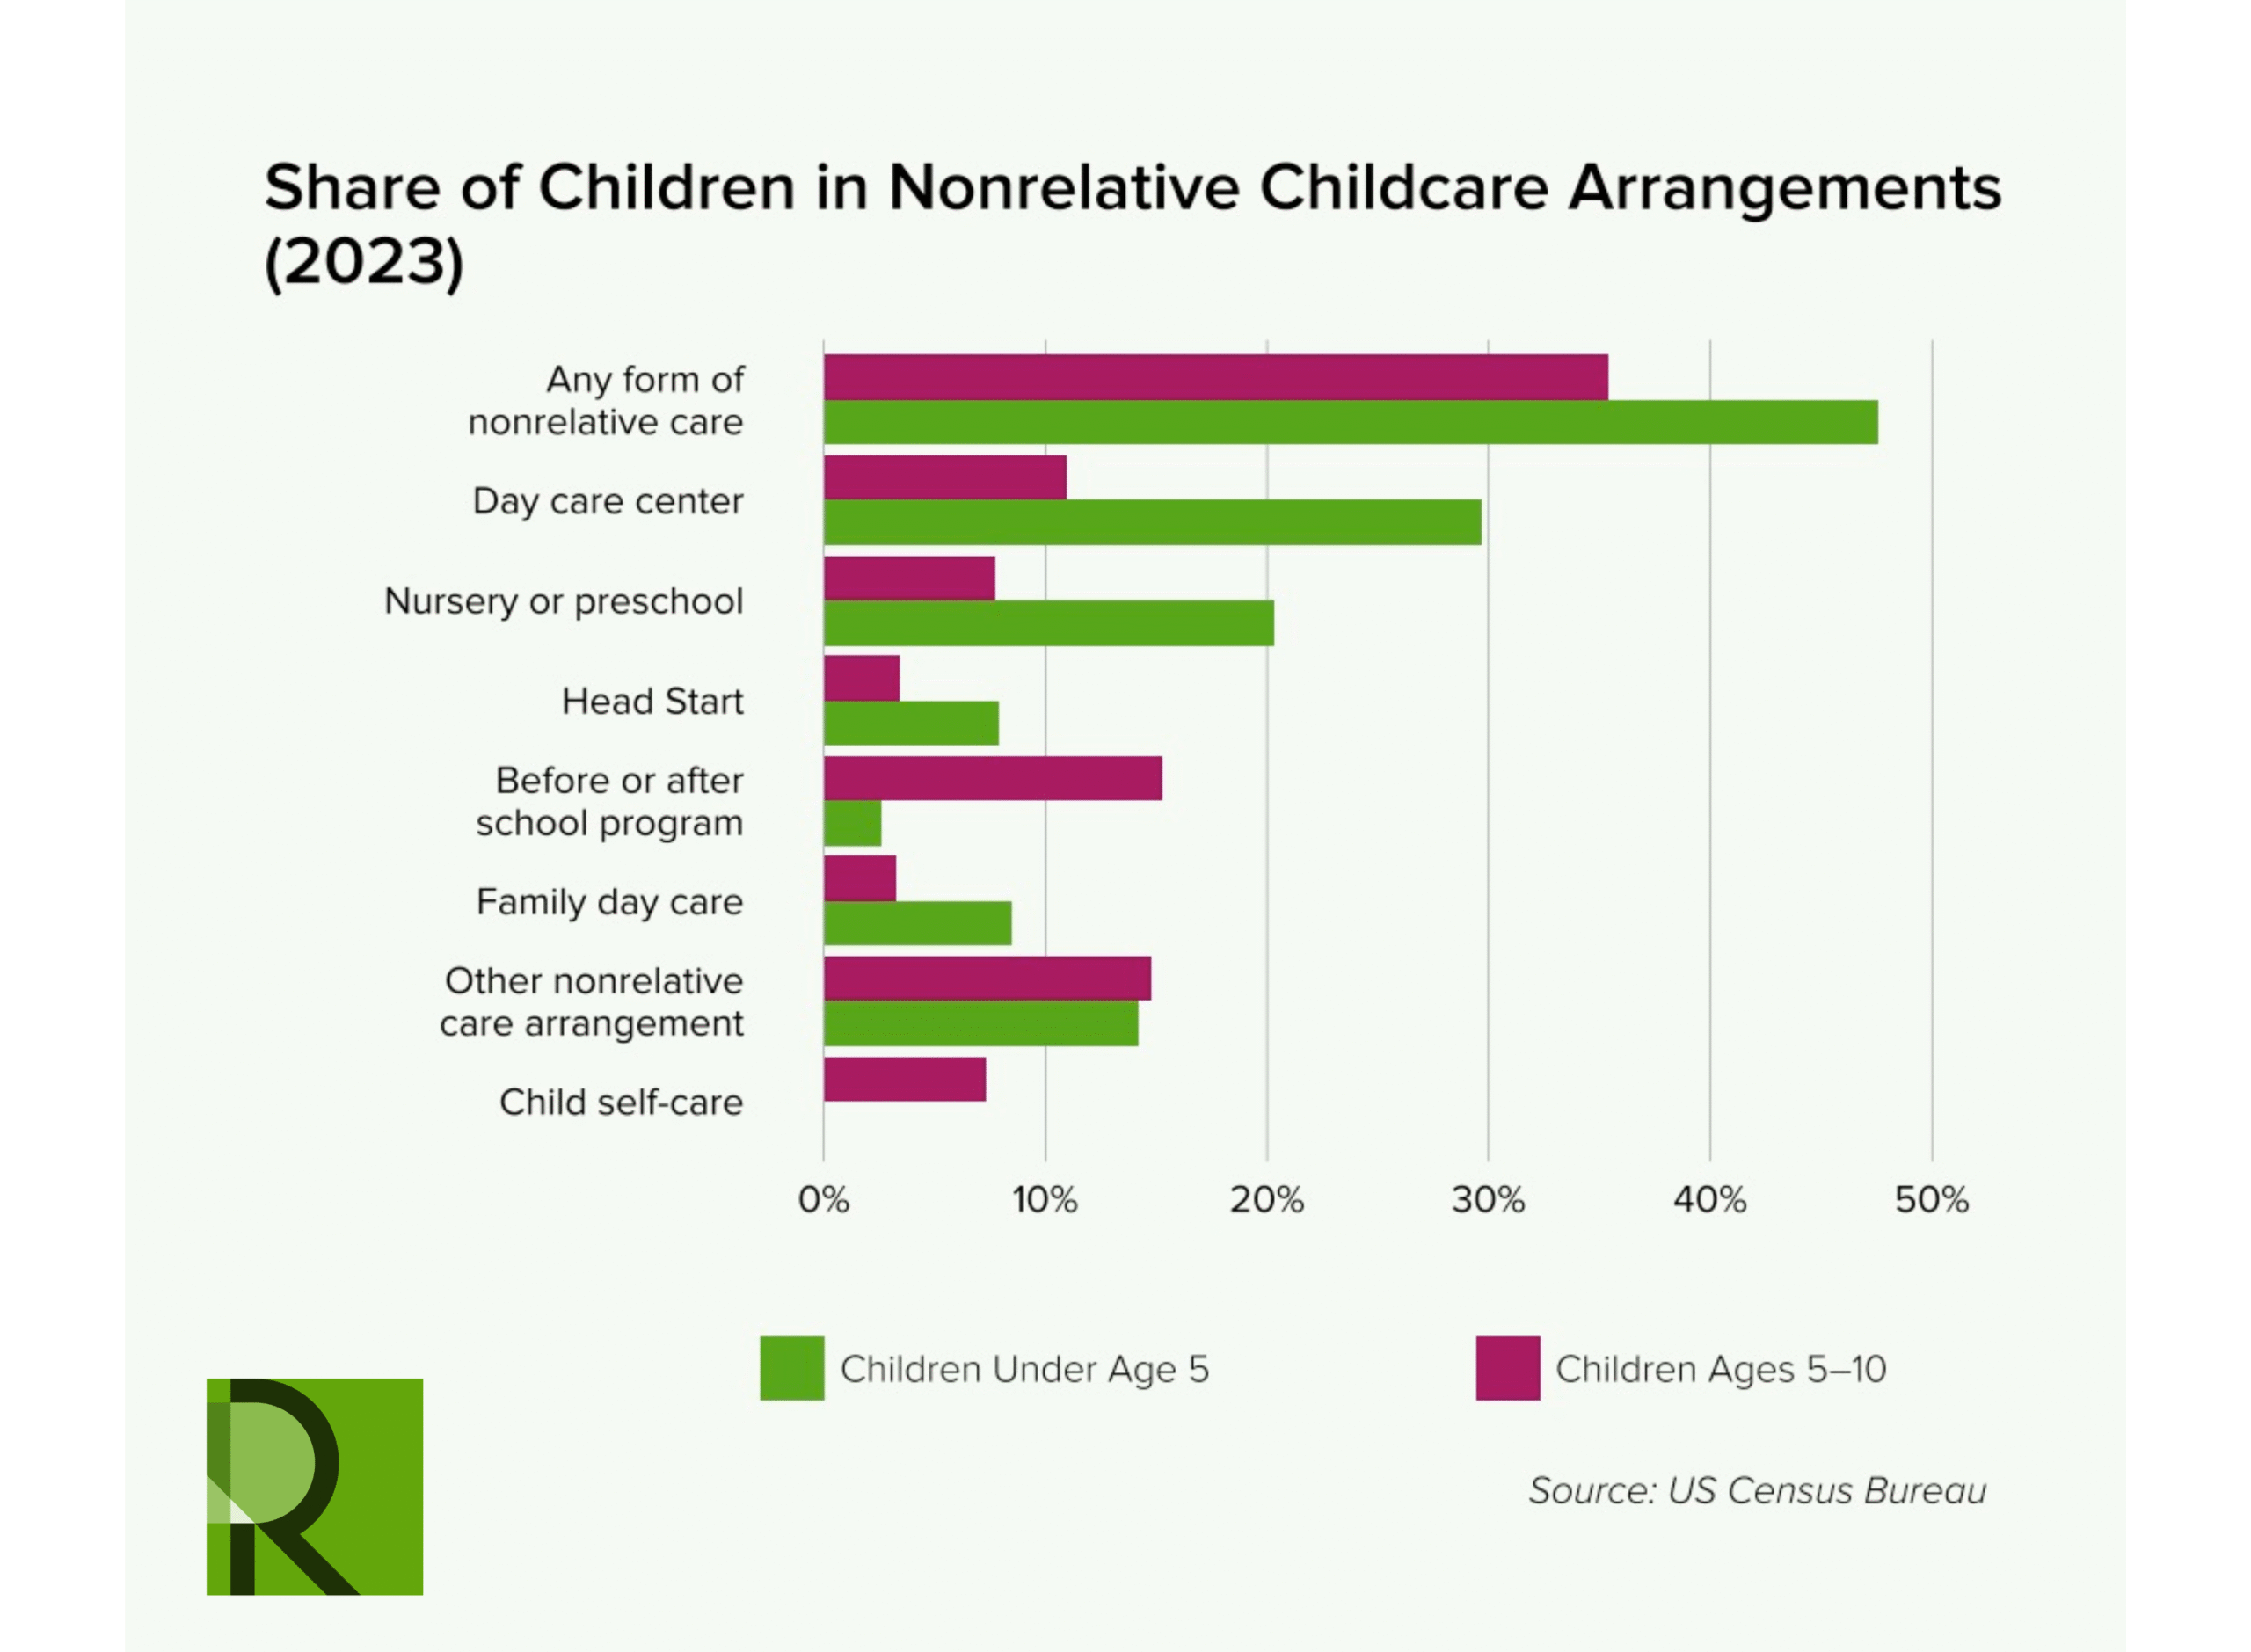
Before- or after-school programs are the most common form of nonrelative care arrangement for school-aged children. These programs can be particularly convenient for families since they are often on the same campus and can functionally extend the school day, in addition to often having lower prices than many other forms of childcare. Overall, center-based care facilities tend to be more expensive than options like family daycare providers, although average prices decline as children advance in age.25 Part of this is because center-based care is more likely to be located in urban settings with higher property costs. Urban locations typically allow providers to serve larger populations, and many families choose care settings closer to their workplace or school rather than their home. This can allow them to avoid paying for care during commutes or make it easier to manage pick-up or drop-off times, but these decisions can also be driven by a lack of childcare options closer to home, especially in more suburban or rural areas.
The majority of parents reported they have only one typical care arrangement in place aside from parental or self-care, but a sizable minority of children are in multiple care arrangements. Most multiple care arrangements are a mix of relative and nonrelative care, with both preschool and elementary school–age children in an average of more than three different arrangements, not including care from their parents or caring for themselves when their parents are busy. One in four children under 5 (24.4 percent) and one in five children ages 5 to 10 (19.2 percent) are in more than one nonrelative care arrangement, most commonly attending a center-based program such as a daycare center or a before- or after-school program and receiving care from another nonrelative like a babysitter, neighbor, or family friend.
Multiple arrangements can also be a sign of more challenging circumstances for families who cannot rely on a single form of care because it cannot meet all their needs.
Multiple care arrangements may reflect parents’ or children’s preferences, like a child being picked up from daycare by a family member excited to spend time with them, or parents of teammates taking turns driving the group to sports practice after school. But multiple arrangements can also be a sign of more challenging circumstances for families who cannot rely on a single form of care because it cannot meet all their needs. Parents who attend night classes may need to access childcare when many facilities and providers are closed, and those relying on care from family members or friends may need to work around their schedules too, especially if they have another job.
Mothers’ Demographics
The theoretical childcare needs of families, as well as their ability to access care, varies along a number of characteristics. Mothers’ labor force participation is a clear example of how different the needs of families can be: Children in both age groups whose mothers are in the labor force are roughly 30 percentage points more likely to have a childcare arrangement compared to children whose mothers are not working or actively looking for work (see Figure 6 and Table 2 in Appendix). This is true both for both children under age 5 and those ages 5 to 10. Children whose mothers are in the labor force are significantly more likely to receive nearly every type of care provision, even after controlling for other factors such as age and mothers’ characteristics such as race and ethnicity.26 The only exceptions are forms of care that are less commonly used overall, such as being watched by a sibling or older children attending Head Start. Additionally, half of all children under age five with working mothers are in multiple care arrangements, along with more than one-third of school-aged children.
Figure 6
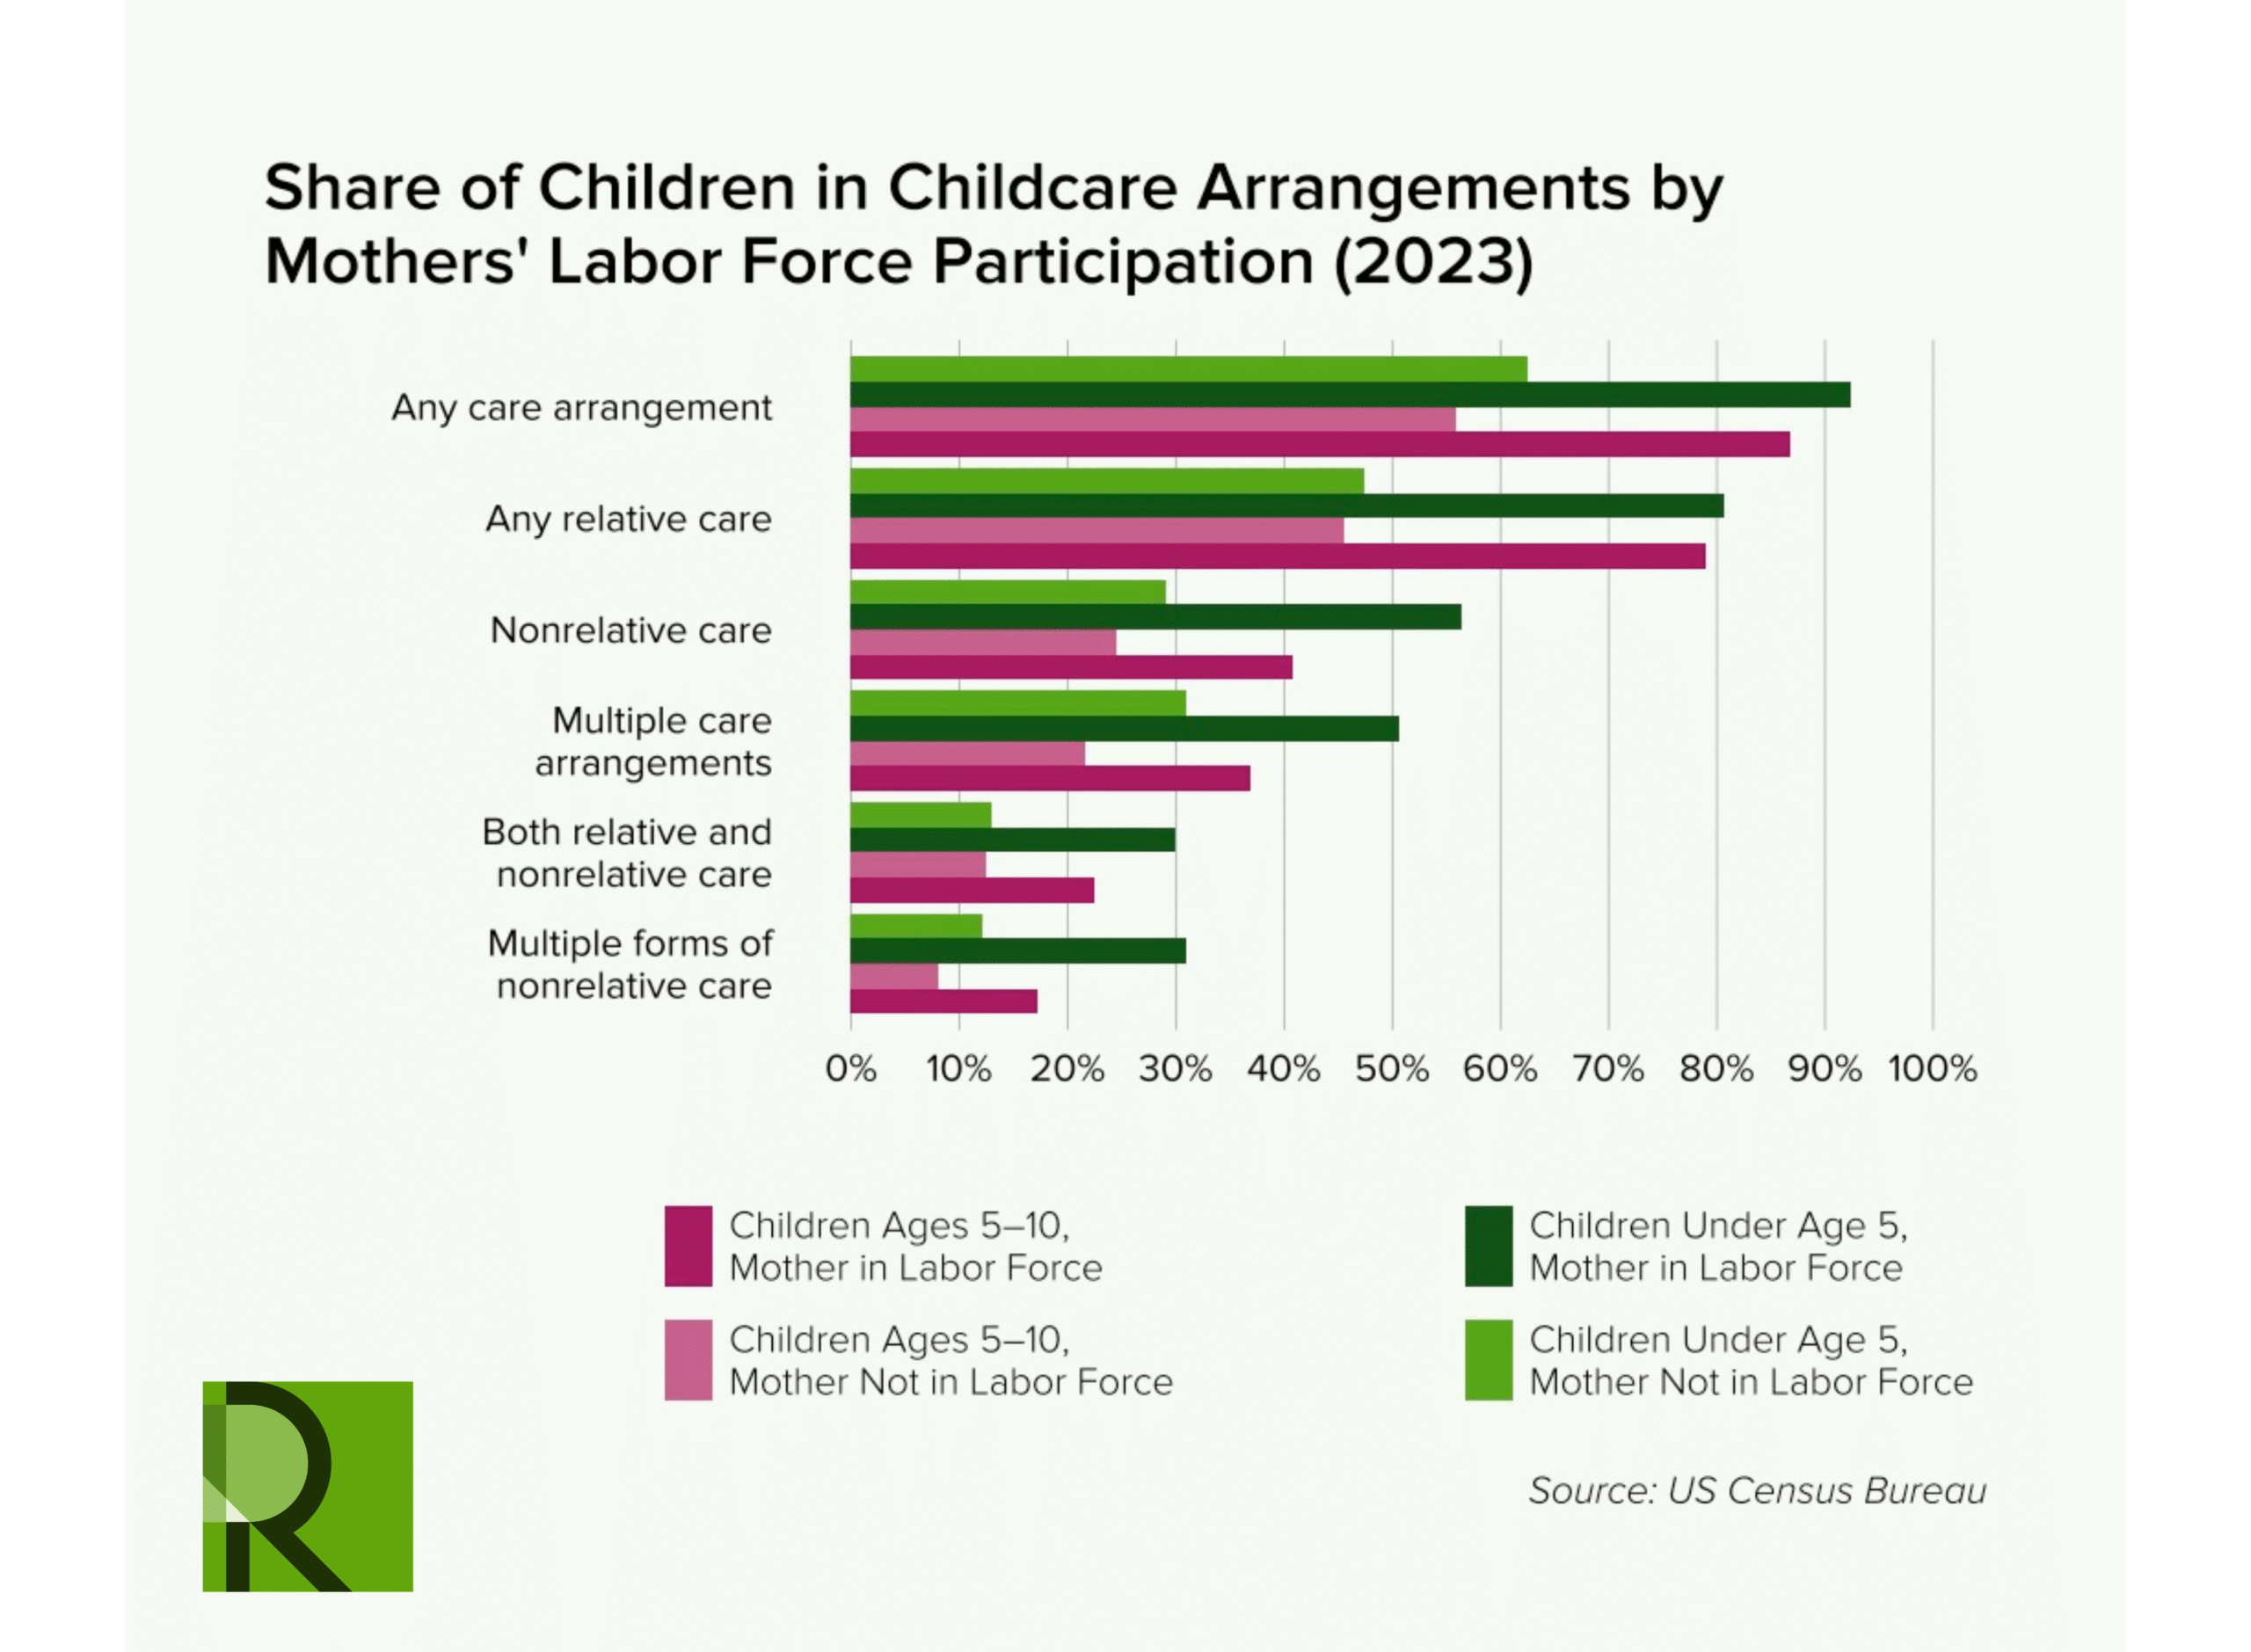
Infants are the least likely to have a regular childcare arrangement, largely because they are the least likely to have a mother in the labor force. But differences between infants and toddlers are no longer statistically significant once their mother’s labor force participation and other factors are controlled for (see Table 2 in Appendix). The use of nonrelative care increases significantly after infants pass their first birthday and continues to increase as they become toddlers. The share of one- to two-year-olds in center-based care is more than twice that of infants under one year old, and the share of three- to four-year-olds is more than triple that of infants. Rates of family-provided care remain constant, however, with no significant differences between the youngest babies and those approaching school age.
Overall usage of childcare increases as babies grow into toddlers and preschoolers, then declines and stabilizes after they reach kindergarten age. While the specific types of care children are in changes as they age between 5 and 10, the likelihood of having some form of care arrangement does not. Once children are 7 years old, they are much less likely to receive most forms of nonrelative care outside of school, likely because school takes the place of other forms of care, but remain equally likely to be cared for by family members like their grandparents.
Along other demographics there are fewer significant differences in care arrangements for children.
Single mothers, who are unmarried and not living with a partner, are more likely to have regular care arrangements in place, and their children are more likely to be cared for by family members like grandparents (see Figure 7 and Table 3 in Appendix). Perhaps unsurprisingly, care provided by the child’s father is the only arrangement that is less likely to be used for children being raised by a single mother, compared to those whose mothers are married or cohabitating. School-aged children whose mothers are unpartnered are more likely to have multiple care arrangements, but otherwise there are few significant differences.
Figure 7
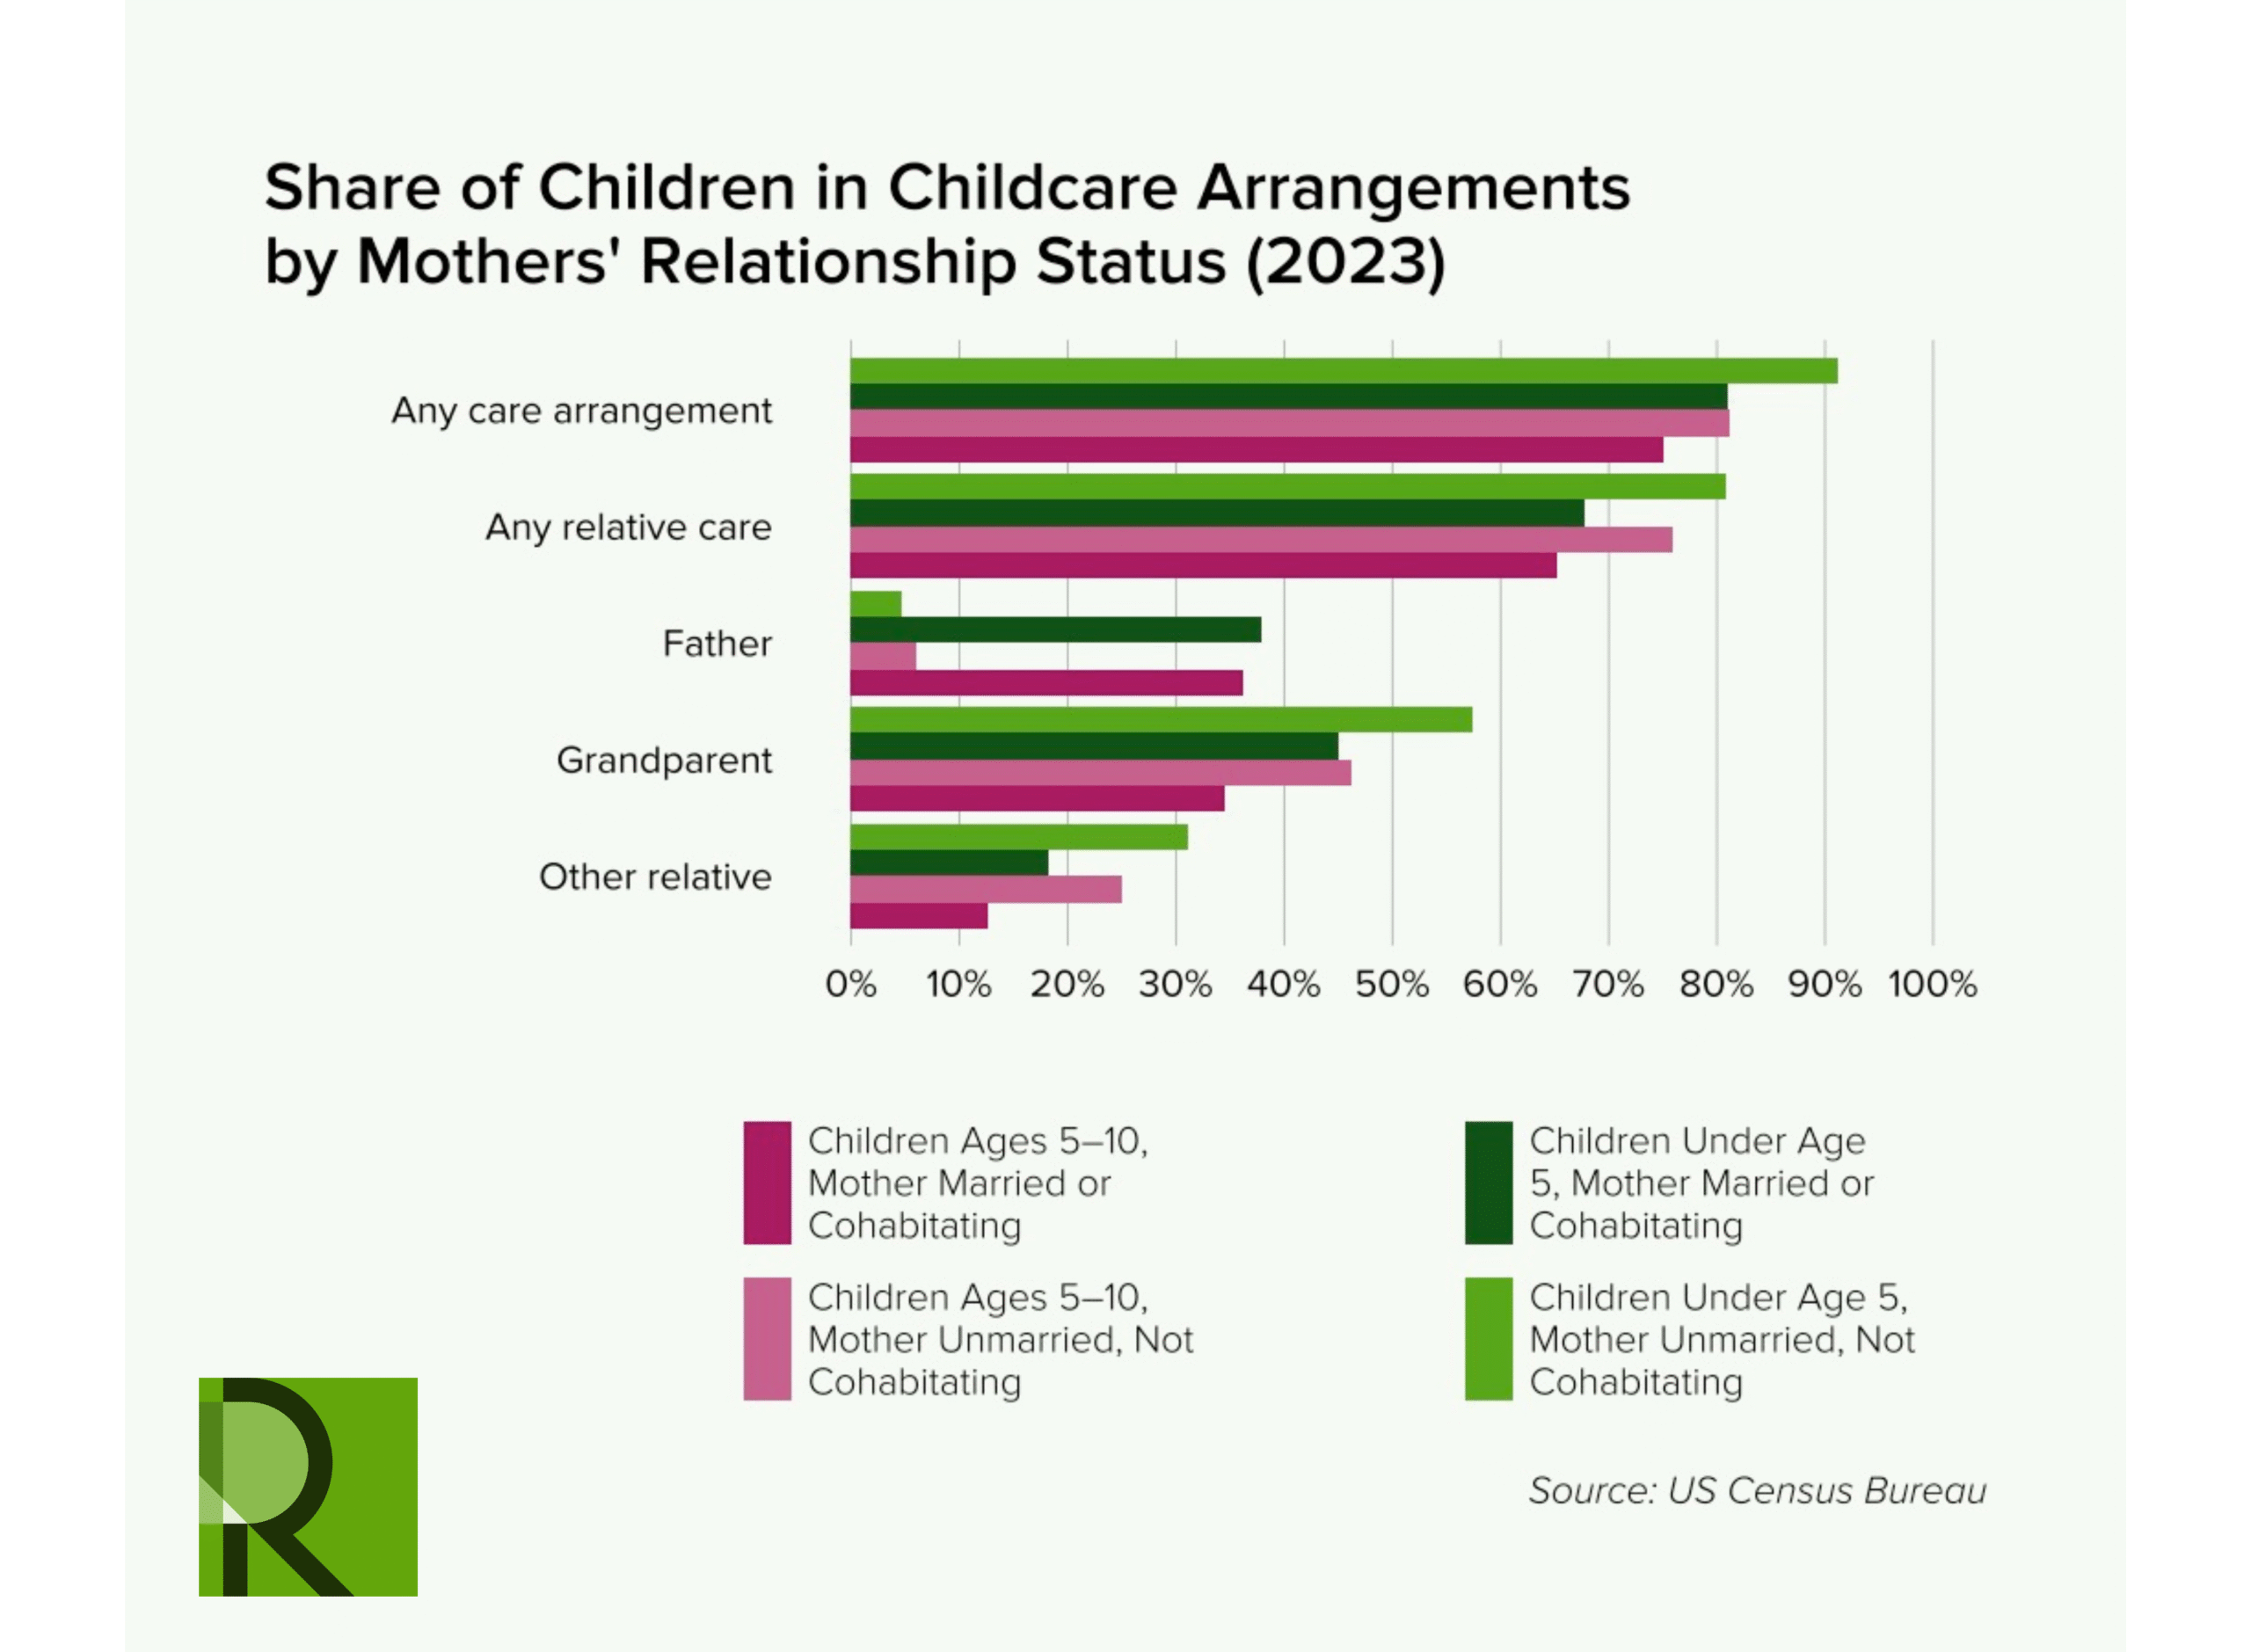
Preschool-aged children living in families below the poverty line are less likely than their peers to receive nonrelative care overall, although the differences are not statistically significant for many specific sources of childcare, such as Head Start or preschools. Poverty is negatively correlated with mothers’ labor force participation, but lower rates of nonrelative care usage are not simply because these children have no need for care since their mother is not working. Statistical testing indicates that both are significant effects—children living in poverty have a lower likelihood of receiving nonrelative care even when controlling for their mothers’ labor force participation (see Table 3 in Appendix). It is highly likely this is due to low-income families’ difficulty accessing and paying for childcare, particularly given high prices for many types of center-based care and the US’s lack of public childcare infrastructure.27 School-aged children living below the poverty line are less likely to have regular care arrangements in place but are equally likely to receive nearly every specific type of childcare, with the exception of care from their father.28
Children living in nonmetro areas are less likely to attend center-based childcare when they are under five, or before- or after-school programs when they are school-aged, than their peers in metropolitan areas (see Table 4 in Appendix). This is likely because there are fewer of these programs in less densely populated areas, particularly in rural communities, which are more likely to be childcare deserts.29 School-aged children in nonmetro areas are more likely to be cared for by siblings, which may be a way that families respond to the lack of formal care options in their communities.
There are few significant differences in childcare arrangements between children by mother’s race or ethnicity (see Table 4 in Appendix). While statistical testing was limited to comparing children of other races or ethnicities to those with white, non-Hispanic mothers, the data in Appendix Table 4 show few meaningful differences in the percentage of children receiving different types of care between children whose mothers are white and children whose mothers are Black, Hispanic/Latina, multiracial, or of any other race or ethnicity.
Children with Hispanic or Latina mothers are less likely to receive nonrelative care, though this breaks down into key differences depending on the age of the child and the type of care. Latino children under five less frequently attend nursery or preschools, though they attend daycare centers, Head Start programs, or family daycares with the same frequency as non-Latino children. School-aged children with Latina mothers are also less likely to receive nonrelative care overall, with most of the difference caused by lower usage of daycare centers and other unspecified nonrelative care providers such as babysitters or nannies. However, there are no differences in frequency of receiving care from a family member or of having multiple care arrangements.
Mothers’ Employment
Children whose mothers are in the labor force are more likely to be in nearly all forms of care arrangements. This includes mothers who are employed as well as those who are unemployed and actively searching for work—however, the sample size of unemployed mothers is small, and there are no significant differences in care arrangements between those in the labor force and those employed. The following analysis is limited to children with an employed mother to examine whether job characteristics have an impact on childcare arrangements. Overall, there are fewer differences in the care arrangements of employed mothers across different work arrangements than might be anticipated. For example, there are no statistically significant differences in care arrangements between children whose mothers work full- or part-time (see Table 5 in Appendix). However, this data only measures whether a child is in a particular care arrangement and not the amount of time spent. It is likely that children whose mothers work longer hours spend more time in the care of others.
There are also few differences for children whose mothers work schedules other than standard daytime hours. Younger children whose mothers work evenings or night shifts are more likely to be in relative care, but the differences are not significant for school-aged children. Preschoolers with mothers who work weekends are especially likely to be in grandparent or other relative care, but there are no significant differences in nonrelative care like daycare centers. Family members are more likely to be available to help with childcare outside of normal working hours, and, since most daycare centers do not operate on weekends, they are likely supplementing the times when center-based care is not available. Since most people do not work every day, mothers who work on weekends are more likely to have time off during nonschool hours on weekdays. This may explain why school-aged children whose mothers work weekends are less likely to receive nonrelative care compared to their peers whose mothers only work on weekdays.
Conclusion
Families and our economy depend on childcare. As of 2024, 30 percent of the labor force were parents, and 15 percent were mothers, which makes the availability of, and families’ access to, childcare a central economic issue. There is widespread acknowledgement that the current childcare system in the United States is failing to meet the needs of families, and policy interventions are necessary to address the long-standing cracks in the nation’s care infrastructure.30
Nearly any parent with young children can enumerate the ways that our current system is broken. Many are hanging on by the skin of their teeth, spending money they don’t have on care arrangements they cannot afford, cobbling together a patchwork of formal and informal care arrangements to get them through until their children are old enough to no longer need childcare. Data consistently show how unaffordable care is, and we know anecdotally that families are struggling to find adequate care. But nationally representative information about what type of care arrangements families are using is rare.
Action to improve our nation’s childcare infrastructure cannot wait, but developing data-driven childcare policies is challenging when information on childcare usage is sparse or unavailable. Having a fuller picture of how families currently use childcare and why types and combinations of care arrangements children are currently will hopefully provide a more complete and fact-based context for ongoing work to address the childcare crisis.
Footnotes
- While technically parents can have children of any age, this brief focus on parents with minor children living in the same home. US Census Bureau, “FM-2. All Parent/Child Situations, by Type, Race, and Hispanic Origin of the Householder or Reference Person: 1970 to 2023,” December 2025, https://census.gov/data/tables/time-series/demo/families/families.html. ↩︎
- US Census Bureau, “CH-1. Living Arrangements of Children Under 18 Years Old: 1960 to Present,” December 2025, https://census.gov/data/tables/time-series/demo/families/children.html. ↩︎
- Caregiving and other forms of household reproduction are undoubtedly work, in that taking care of children and other loved ones involves a significant amount of labor. However, caregiving within families, particularly parents caring for their own children, is not paid work. For the purposes of this brief, unless otherwise noted, work refers to labor that results in compensation—such as through employment, self-employment, or contract labor—and people who work are those who participate in the labor force (either because they currently have a job or they have actively looked for a job in the past four weeks). ↩︎
- US Bureau of Labor Statistics (BLS), “57. Employment Status of the Civilian Noninstitutional Population by Sex, Presence and Age of Children, Race, and Hispanic or Latino Ethnicity,” last modified February 20, 2026, https://bls.gov/cps/cpsaat57.htm. ↩︎
- US BLS, “Marital and Family Labor Force Statistics from the Current Population Survey,” accessed April 1, 2026, https://data.bls.gov/dataQuery/find?fq=survey:%5Bfm%5D&s=popularity:D. ↩︎
- Married mothers, mothers to infants, and Hispanic or Latina mothers are all less likely to participate in the labor force compared to other comparable mothers. But even where these identities overlap, the majority of mothers work—in 2024 over half of married Hispanic or Latina mothers with a child under one year old participated in the labor force. US BLS, “Marital and Family Labor Force Statistics from the Current Population Survey.” ↩︎
- US Census Bureau, “Presence of Own Children Under 18 Years by Family Type by Employment Status,” American Community Survey, Table B23007, accessed March 17, 2026, https://data.census.gov/table/ACSDT1Y2023.B23007?t=Children:Employment+and+Labor+Force+Status&y=2023. ↩︎
- US Census Bureau, “Age of Own Children Under 18 Years in Families and Subfamilies by Living Arrangements by Employment Status of Parents,” American Community Survey, Table B23008, accessed June 10, 2025, https://data.census.gov/table/ACSDT1Y2023.B23008?t=Children:Employment+and+Labor+Force+Status. ↩︎
- US Census Bureau, “Presence of Own Children Under 18 Years by Family Type by Employment Status,” American Community Survey, Table B23007, accessed April 1, 2026, https://data.census.gov/table/ACSDT1Y2024.B23007. ↩︎
- Ying-Chun Lin and Meghan McDoniel, Understanding Child Care and Early Education Program Closures and Enrollment during the First Year of the COVID-19 Pandemic (Office of Planning, Research, and Evaluation, 2023), https://acf.gov/sites/default/files/documents/opre/2023-237%20COVID%20Highlight.pdf. ↩︎
- US Department of the Treasury, The Economics of Child Care Supply in the United States (September 2021), https://home.treasury.gov/system/files/136/The-Economics-of-Childcare-Supply-09-14-final.pdf. ↩︎
- National Center for Education Statistics, State Education Practices (SEP) (US Department of Education, 2020), https://nces.ed.gov/programs/statereform/tab1_3-2020.asp. ↩︎
- National Center for Education Statistics, Schools and Staffing Survey (SASS) (US Department of Education, 2007–08), https://nces.ed.gov/surveys/sass/tables/sass0708_035_s1s.asp; US BLS, “Average Hours Employed People Spent Working on Days Worked by Day of Week,” accessed March 17, 2026, https://bls.gov/charts/american-time-use/emp-by-ftpt-job-edu-h.htm. ↩︎
- Lena Bilik, Mary Beth Salomone Testa, Suzanne Kahn, Nina Dastur, and Meredith Loomis Quinlan, Building a Vision for Universal Public Childcare: Principles for a Childcare System That Works for Workers and Families (Roosevelt Institute, 2025), https://rooseveltinstitute.org/publications/building-a-vision-for-universal-public-childcare. ↩︎
- US Department of Health and Human Services, Parents Under Pressure: The US Surgeon General’s Advisory on the Mental Health & Well-Being of Parents (Office of the US Surgeon General, 2024), https://hhs.gov/sites/default/files/parents-under-pressure.pdf; Sheri Reed, This Is How Much Child Care Costs in 2025 (Care.com, 2025), https://care.com/c/2025-cost-of-care-report. ↩︎
- The database offers childcare price data for most states at the county level by childcare provider type, age of children, and county characteristics. US Department of Labor, “National Database of Childcare Prices,” accessed March 17, 2026, https://dol.gov/agencies/wb/topics/featured-childcare. ↩︎
- Updated data collection for the National Survey of Early Care and Education took place in 2024 and preliminary findings and datafiles are anticipated to be released in late 2026. National Opinion Research Center, “2024 National Survey of Early Care and Education,” accessed March 17, 2026, https://norc.org/research/projects/2024-national-survey-of-early-care-and-education.html. ↩︎
- US Census Bureau, Who’s Minding the Kids? Child Care Arrangements: Winter 1984–85 (May 1987), https://census.gov/library/publications/1987/demo/p70-09.html; Lynda Laughlin, Who’s Minding the Kids? Child Care Arrangements: Spring 2011 (US Census Bureau, April 2013), https://census.gov/library/publications/2013/demo/p70-135.html. ↩︎
- The SIPP was redesigned in 2014, and questions about childcare were subsequently changed again in 2019. For more information on the history of the SIPP, see US Census Bureau, “SIPP Introduction & History,” last revised August 16, 2022, https://census.gov/programs-surveys/sipp/about/sipp-introduction-history.html. For more information on the 2023 SIPP, see US Census Bureau, 2023 Survey of Income and Program Participation Users’ Guide (July 2024), https://census.gov/programs-surveys/sipp/tech-documentation/methodology/2023_SIPP_Users_Guide_OCT24.pdf. ↩︎
- Some questions were asked of a more limited subset; for example, questions about sibling care were only asked of parents who had another child in the home age 15 or older. ↩︎
- If no parent is in the household, the child’s guardian is considered the reference parent. ↩︎
- Significant at the 0.5 level. ↩︎
- Parents with minor children were more likely than nonparents to telework throughout 2023 and remain more likely as of June 2025. US BLS, “Telework or Work at Home for Pay,” accessed April 1, 2026, https://bls.gov/cps/telework.htm#data. ↩︎
- SIPP data asks about childcare arrangements in the fall and does not reflect how parents arrange care for school-aged children over the summer months, when most schools are not in session. ↩︎
- US Department of Labor, “National Database of Childcare Prices,” accessed March 17, 2026, https://dol.gov/agencies/wb/topics/featured-childcare. ↩︎
- Tests for statistical significance were conducted at the 0.05 level. Significance testing reflects differences when controlling for children’s age and mothers’ race and ethnicity, labor force participation, partner status, metropolitan status, and poverty status. ↩︎
- Bilik et al., Building a Vision for Universal Public Childcare. ↩︎
- While statistical testing controls for mothers’ labor force participation and whether she is living with a partner, it does not control for fathers’ employment. It is possible that school-aged children living below the poverty line are more likely than their peers to have fathers with work schedules that conflict with caregiving. ↩︎
- Rasheed Malik, Katie Hamm, and Leila Schochet, “America’s Child Care Deserts in 2018,” Center for American Progress, December 6, 2018, https://americanprogress.org/article/americas-child-care-deserts-2018. ↩︎
- Suzanne Khan, “Investing in Care: Exploring an Industrial Strategy for Care Work,” Roosevelt Institute, May 23, 2024, https://rooseveltinstitute.org/publications/investing-in-care. ↩︎
Acknowledgments
The author would like to thank Michael Madowitz, Katherine De Chant, and Noa Rosinplotz for their feedback, insights, and contributions to this paper. Any errors, omissions, or other inaccuracies are the author’s alone.
Suggested Citation
Glynn, Sarah Jane. 2026. Who’s Minding the Kids These Days?: An Analysis of Children’s Care Arrangements. New York: Roosevelt Institute.
RELATED RESOURCES
Author

Sarah Jane Glynn
Former FellowAs a former Roosevelt Institute fellow, Sarah Jane (SJ) Glynn researched workers’ experiences in the labor market, particularly the experiences of women, all workers of color, and workers in low-paid jobs.