Who Makes Up the Labor Force?: Projecting Workforce Growth over the Next Decade
May 12, 2026
By Oskar Dye-Furstenberg


Key Takeaways
- The service sector, which makes up the vast majority of the economy, also accounts for the industries with the most projected growth over the next decade: educational and health services, professional and business services, and leisure and hospitality.
- Within these growing industries, jobs for non-college-educated workers are concentrated in low-paying service-sector occupations.
- Over the next decade, the occupations with the most projected growth are home health and personal care aides (approximately 600,000 jobs by 2034) and fast-food and counter workers (approximately 200,000 jobs by 2034).
- Both of these jobs are currently performed by a predominantly female and disproportionately non-white workforce, the majority without college degrees.
- Pro-worker economic policies that target these low-wage occupations—supporting employment, wage growth, and worker bargaining power—are in turn policies that should strengthen the economic position of the diverse marginalized groups that comprise significant shares of this labor force.
Introduction
The US economy is deeply divided. A decline in middle-class job growth, the rise of shareholder primacy, and a pro-corporate regulatory environment have all contributed to the polarization of income and employment over the past 50 years. Inequality in income is coupled with an extreme concentration of wealth, with the top 1 percent holding over 30 percent of all US household wealth. The growth of this wealth and income inequality has given rise to references to a “k-shaped” or “dual” economy to describe the state of affairs in which wealthy asset holders and the highest-income earners continue to gain while prospects diminish for those on the bottom.1
Making matters more complex, market opportunities and outcomes are not equal within the lower leg of this “k,” with earnings at the bottom of the wage distribution variegated by education, race, and gender, among other factors. The divergence in labor market outcomes associated with education, while neither an exhaustive nor direct measure of economic “class,” remains substantial. In particular, the earnings premium conferred by postsecondary education rose significantly in the latter decades of the 20th century, though appears to have stagnated in more recent years. Furthermore, inequality in earnings among college-educated workers has grown significantly.
A majority of the workforce, however, doesn’t have a college degree and often faces greater barriers to economic attainment and security. The non-college-educated workforce is also less white, composed of larger shares of Black, Hispanic, and Native American workers than the college-educated workforce. In 2025, the labor force participation rate for non-college-educated workers plateaued below pre-COVID-19 trends and as the unemployment rate edged upwards, recent high school graduates and young workers without a college degree were especially affected.
This brief provides a snapshot of the workforce today, highlighting the demographics of workers without a college degree, the kinds of jobs they hold, and what employment opportunities may be in store for them over the coming decade. Jobs in health services, professional and business services, leisure and hospitality, and construction are projected to experience the most dramatic growth. Within these growing industries, jobs for non-college-educated workers are concentrated in low-paying service-sector occupations such as home health and personal care and jobs at fast-food establishments. These trends highlight the necessity of policy interventions to support job opportunity, economic security, and bargaining power for these workers. As the labor force of these low-wage service occupations is also disproportionately female and non-white, pro-worker policies must simultaneously serve to advance racial and gender equity.
Employment Today
What does the workforce look like?
Our economy is made up of various industries and occupations. Some sectors and jobs are composed primarily of workers with a BA, and others without. Factors like race and gender are also connected to a worker’s average wages and what types of jobs they’re most likely to have. Use the data dashboard below to explore the demographic makeup of different sectors, the projected growth of certain occupations over the next decade, and the wages that workers in those jobs currently make.
a. Today’s Workforce
There are nearly 160 million workers in the labor force today, working across a variety of industries and occupations.2 Service-providing industries account for over 80 percent of employment and GDP, a marked shift from the 1950s—when this share was less than 60 percent—that reflects deep structural changes in the nature of economic growth in the US, employment, and the skills it demands.
The largest industries with the highest job growth are and will, in the near future, continue to be in the service sector. From 2014 to 2024 the industries that showed the most significant growth in employment were educational and health services, which added over 4 million jobs (25 percent growth), and professional and business services, which added 3.4 million (23 percent growth). Trailing behind are transportation and utilities and construction (the one non-service-providing industry in the group), which both grew by approximately 2 million (39 and 33 percent growth, respectively).3 In 2024, 32.5 million workers were employed in the top 10 most common detailed occupations, which are primarily low-wage service-sector jobs, such as home health and personal care aides, retail salesperson, and fast-food counter workers. For all but two of these occupations, average hourly wages were less than $22, with half of these occupations paying under $20 per hour. In comparison, across the economy as a whole, mean hourly wages were $32.66 in 2024, with a median of $23.80 an hour.4
Workers within these industries and occupations are not homogenous, and differences in earnings within industries and occupations can be highly significant. To begin with, the workforce is divided in terms of education. The percentage of the US population with at least a college degree has increased tremendously over the past 80 years, from under 5 percent in 1940 to nearly 40 percent in 2021. For the civilian workforce ages 25 and older, this share is slightly higher at 45 percent in 2025. Still, as shown in Figure 1, a majority of workers lack a bachelor’s degree, with 49 percent possessing a high school diploma or some amount of college, and 6 percent lacking a high school diploma.
Figure 1.
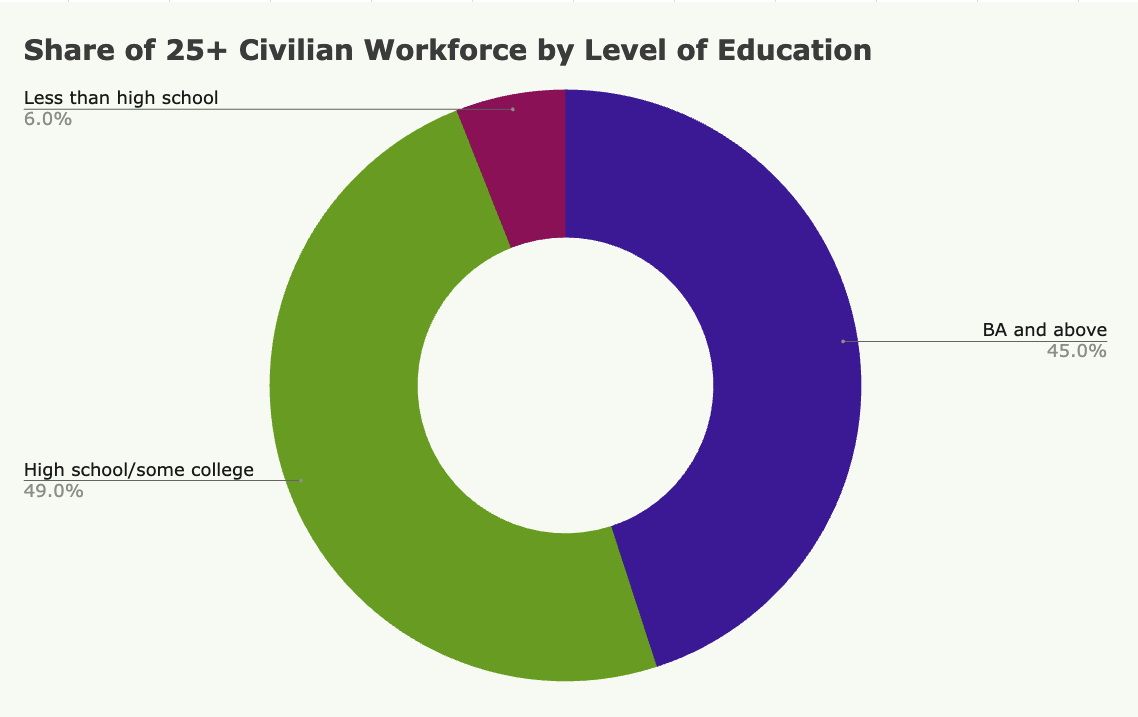
Those with a BA or more have higher labor force participation rates and lower unemployment rates, as well as higher earnings. Table 1 provides figures for 2025; however, these differences have remained persistent for decades.
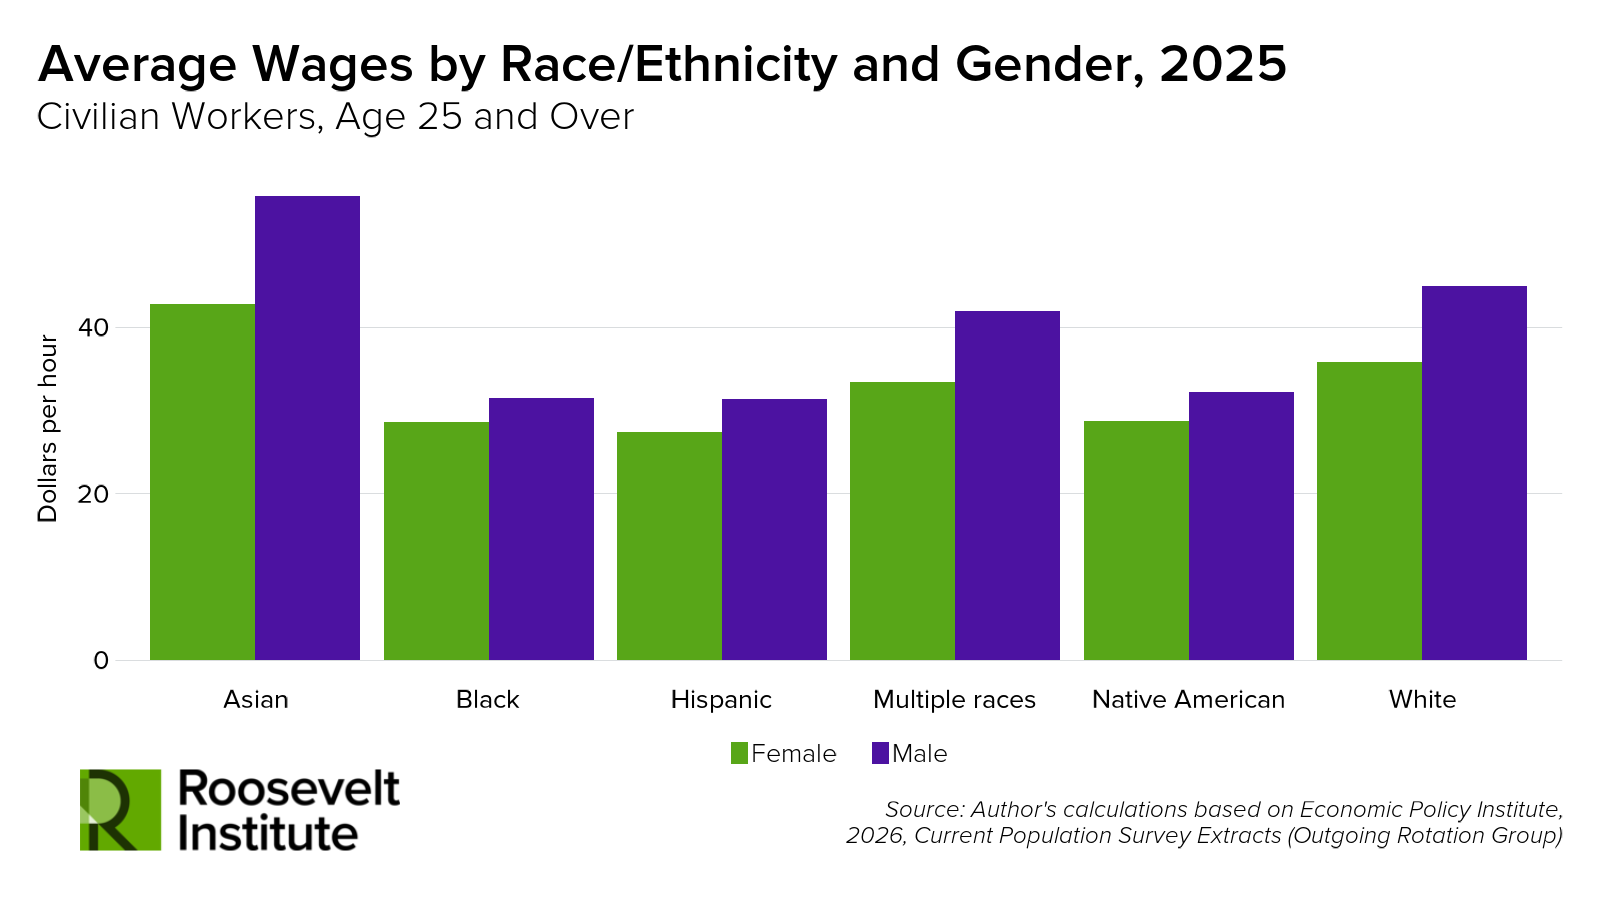
Economic outcomes for the workforce are also differentiated across race, ethnicity, and gender. Average hourly earnings among Black workers, for example, was about 75 percent of average earnings of white workers. Differences in worker earnings, observable across education, race, and gender, are significant both within and across lines of industry and occupation. In what follows we take a closer look at how economic polarization is structured by employment, and what this means for the non-college-educated labor force going forward.
Figure 2.5
b. Looking Ahead: Employment Trends to Watch
Every year, the Bureau of Labor Statistics (BLS) publishes 10-year employment projections. These projections provide estimates for level and rate changes in the workforce across industry and occupation groups. As this brief will show, the BLS’s projections of occupation and industry employment growth suggest that most employment opportunities for workers with less than a BA are concentrated in low-paying service-sector jobs. At present, non-white workers comprise a larger share of workers in these jobs compared to their overall share of the labor force. Furthermore, the two occupations with by far the most growth opportunity for non-college-educated workers—home health and personal care aides and fast-food and counter workers—are both currently predominantly female workforces.
As Figure 3 below shows, the BLS projects that educational and health services will add approximately 2 million jobs over the next decade, significantly more than any other industry. Notably, this is almost entirely driven by health services, with educational services expected to barely add more than ten thousand jobs. Next, professional and business services is expected to add just over 1 million jobs. Then, the leisure and hospitality industry is expectedto add 686,000 jobs, followed by construction at a distant fourth with an anticipated gain of 360,000 job additions.
Figure 3.
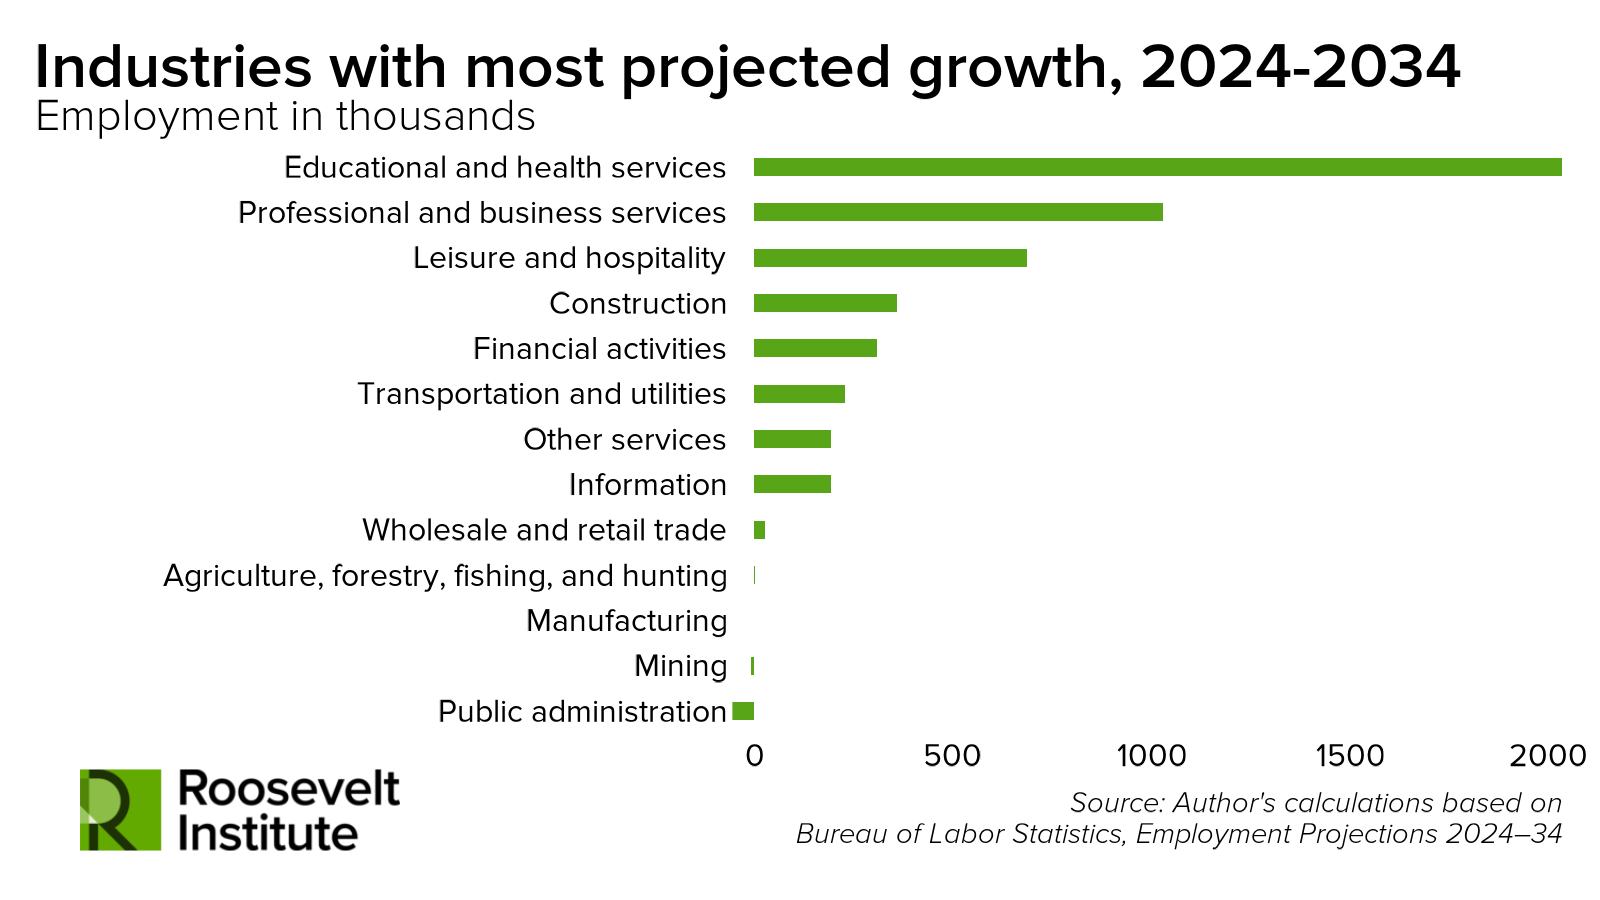
The five industries currently employing the greatest shares of the non-college-educated workforce are educational and health services (17 percent), wholesale and retail trade (14 percent),6 manufacturing (12 percent), professional and business services (10 percent), and construction (11 percent) (Table 2a, Appendix). Wholesale and retail trade, manufacturing, and professional and business services—together employing more than one-third of the non-college-educated workforce—are expected to add a combined total of approximately 1 million jobs. Almost the entirety of this growth stems from professional and business services, with manufacturing anticipated to experience a net loss. All projections presented in Figure 3 are for total job growth, not specific to an educational attainment category.
Workers employed in information, mining, construction, financial activities, and public administration industries have the highest average wages for non-BA workers (Table 3a, Appendix). While two of the industries in this group, construction and financial activities, rank fourth and fifth in terms of gross job additions (as shown in figure 4), their projected growth is far less than that projected for education and health services, professional and business services, or leisure and hospitality. Notably, educational and health services and leisure and hospitality fall within the five industries with the lowest average wages for workers without a bachelor’s degree (Table 3a, Appendix).
Among the four industries expected to grow the most over the next decade (as depicted in Figure 3), 56 percent of workers in the top ten occupations, on average, have less than a BA. Educational and health services exhibits the most even split in its workforce with 57 percent having a college degree and 43 percent without. The other three industry groups are far more skewed: The share of workers in professional and business services with a BA or more is77 percent, whereas in leisure and hospitality 19 percent of workers have a BA or more, and in construction this figure is only 13 percent (Table 6a, Appendix).
Projected Trends in High-Growth Sectors Over the Next Decade
a. Health Services
The educational and health services industry is projected to add nearly 2 million jobs, driven largely by the aging of the US population. From 2024 to 2034, the population of adults 65 or over in the US is projected to increase from 59.7 million to 72.5 million. This demographic shift is expected to heighten demand for medical services and eldercare. The BLS also identifies an “elevated chronic disease burden in the general population [as] another major contributor to healthcare demand” in the coming decade. (The rise in chronic disease is driven both by the aging of the population and an increasing observed and projected prevalence of conditions such as obesity, depression, high blood pressure, and diabetes among young adults.)
Educational and health services is already the single largest industry in terms of jobs today, employing nearly a quarter of the total civilian labor force aged 25 and older. About 31.9 percent of workers with at least a BA and 16.7 percent of workers without a college degree are employed in this industry (Table 2a, Appendix). This translates to 60.8 percent of workers within the industry with a BA and 39.2 percent without (Table 1a, Appendix). Despite the predominant share of workers with college degrees or higher within the industry, more of the non-college-educated workforce is employed in this industry than in any other.
As shown in Table 2, the industry as a whole is nearly 75 percent female and over 38 percent non-white. Among workers without a BA (Table 2.1), the female share is slightly higher, at 79 percent, and the share of non-white workers—predominantly Hispanic and Black women—almost 10 percent higher.
Next, Figures 5 and 6 below present the occupations within the educational and health services industry that are expected to add the most jobs from 2024 to 2034. Four out of the five occupations projected to grow the most are, at present, largely composed of workers with a BA or more (BA+). However, the single largest source of job growth in the educational and health services occupation is projected to occur among home health and personal care aides, at approximately 600,000—more than triple the growth of the next largest group.7 Workers in this occupation are 84 percent female and 14 percent male, with men receiving $2 an hour more than women on average ($19.65 an hour versus $17.67). There is also a significantly higher share of non-white workers in this occupational group than in the industry as a whole. Although Black workers make up 15 percent of the industry as a whole (Table 2) and 21 percent of workers with less than a BA within it (Table 2.1), they comprise over 27 percent of home health and personal care aides.8 And while the industry is currently composed of majority BA+ workers, more than 80 percent of workers in this occupation lack a college degree (Figure 4 below).
Figure 4.9
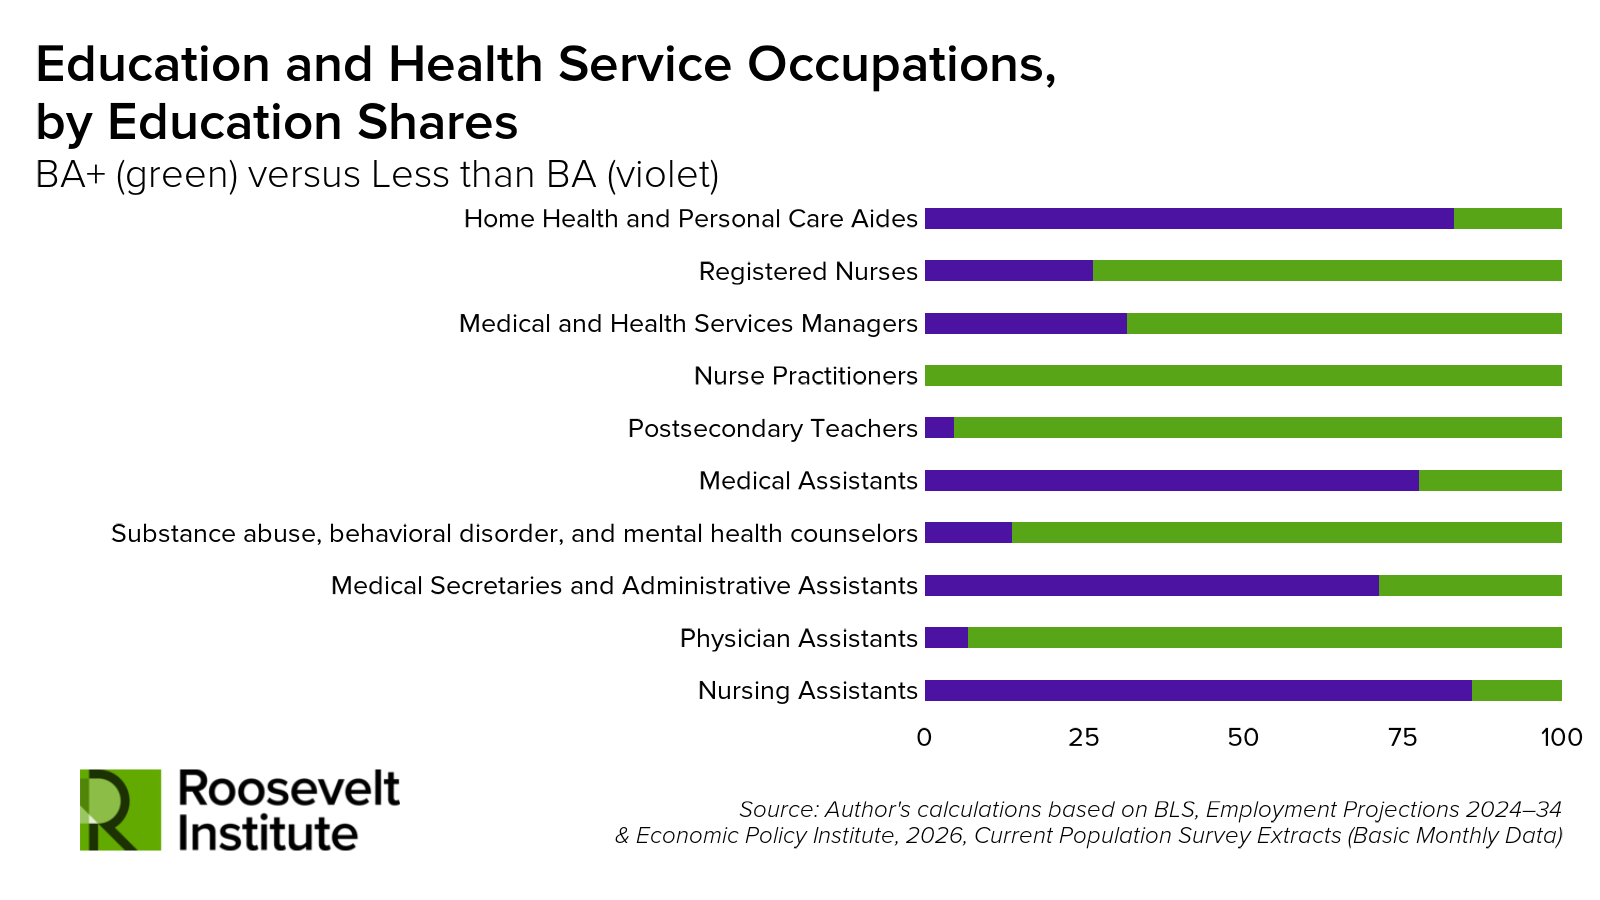
Figure 5 presents average wages by log employment growth for the top growing educational and health service occupations. As shown, home health and personal care aide jobs pay relatively low wages on average, at $20 an hour, compared to the rest of the occupations in the top growing group.
Figure 5.
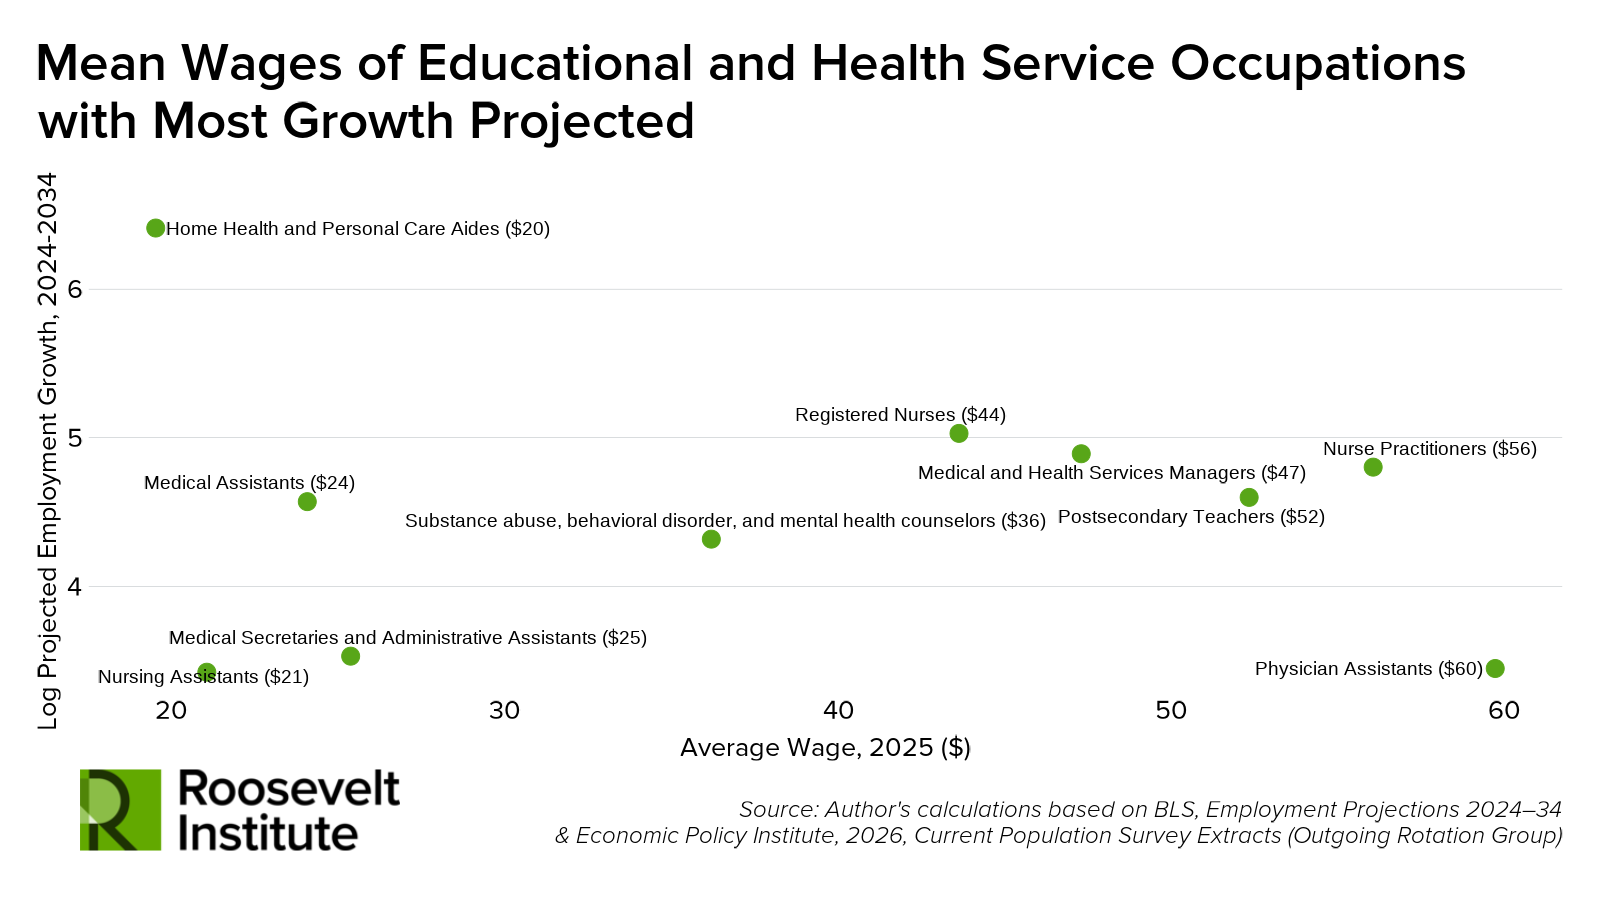
A cursory comparison of Figures 4 and 5 indicates that higher wage premiums correspond with a higher share of BA+ employment for that occupation. All occupations with a majority non-college-educated worker share (home health and personal care aides, medical assistants, medical secretaries and administrative assistants, and nursing assistants) pay an average wage of $25 an hour or less, while those with a majority BA+ share pay hourly wages ranging from $36 to $60 on average.
b. Professional and Business Services
The economy is projected to add approximately 1 million jobs in professional and business services by 2034. While the BLS acknowledges that the effect of AI on job growth is highly uncertain, they project heightened labor demand for certain IT and computing occupations, which will impact the growth of professional and business services. Currently this industry employs nearly 14 percent of the 25+ civilian workforce as a whole. Just above 18 percent of all workers with a BA or more are employed in the industry, the second-highest share after educational and health services (Table 2a, Appendix). Within the industry, 60 percent of workers have a BA degree or more, 58 percent are male, and 61 percent are white (Table 3).
The average wage for BA+ workers in professional and business services is $60.38 an hour, compared to $28.36 an hour for workers with less than a BA.10 Men employed within the industry earn an average of $52.64 an hour while women earn $41.67. As Table 3.1 indicates, the gender and racial demographic shares of workers without a BA is roughly proportional to workers overall in the industry.
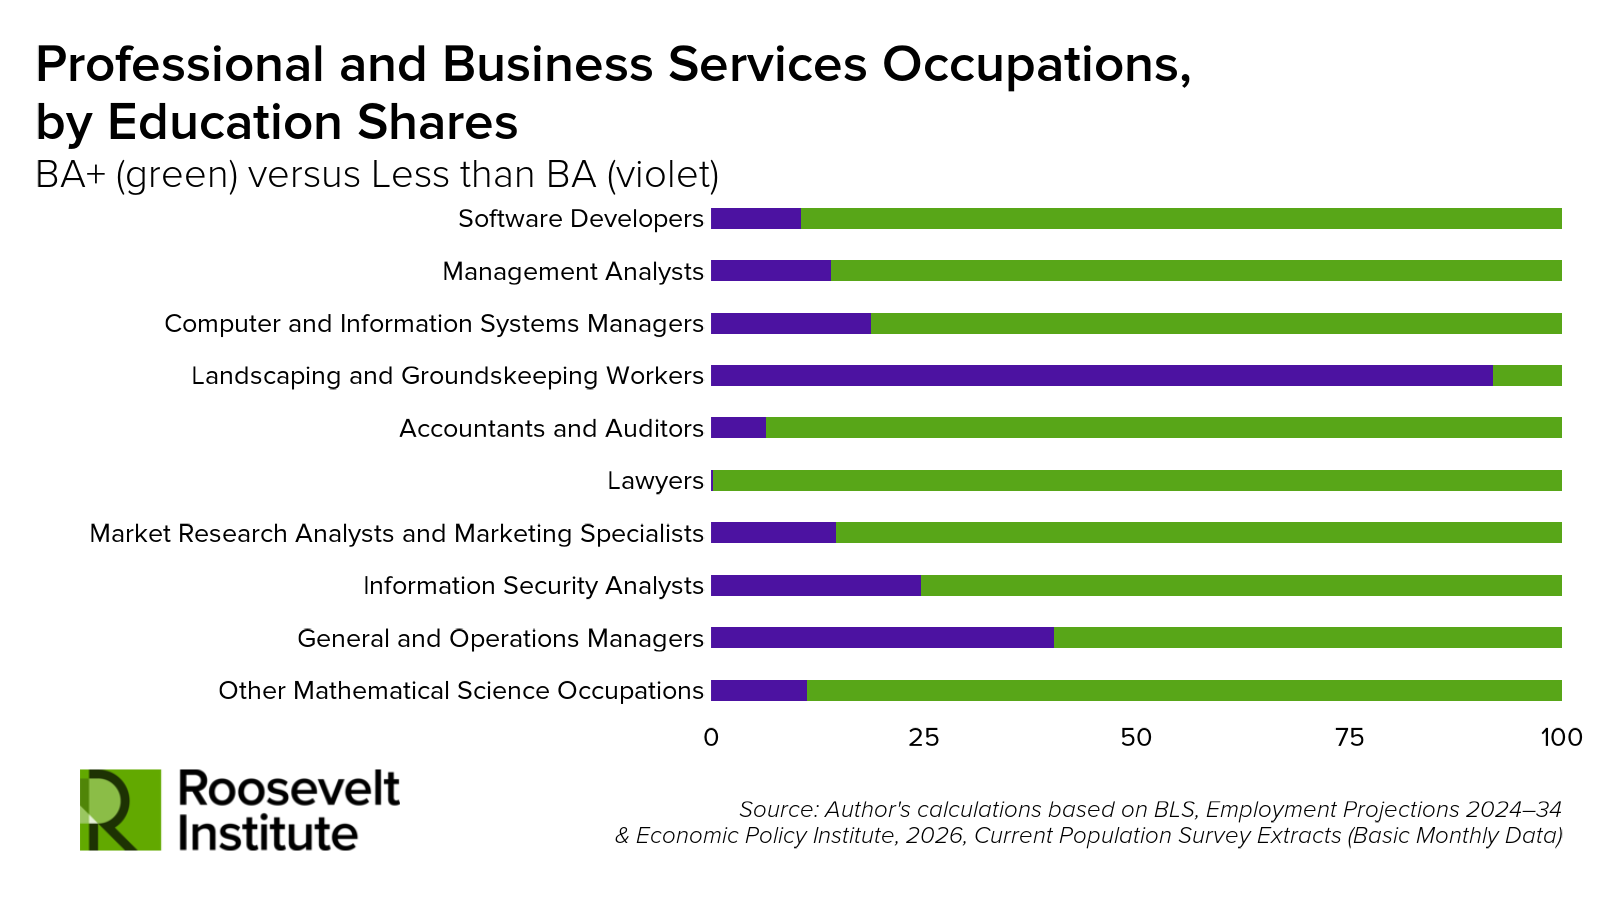
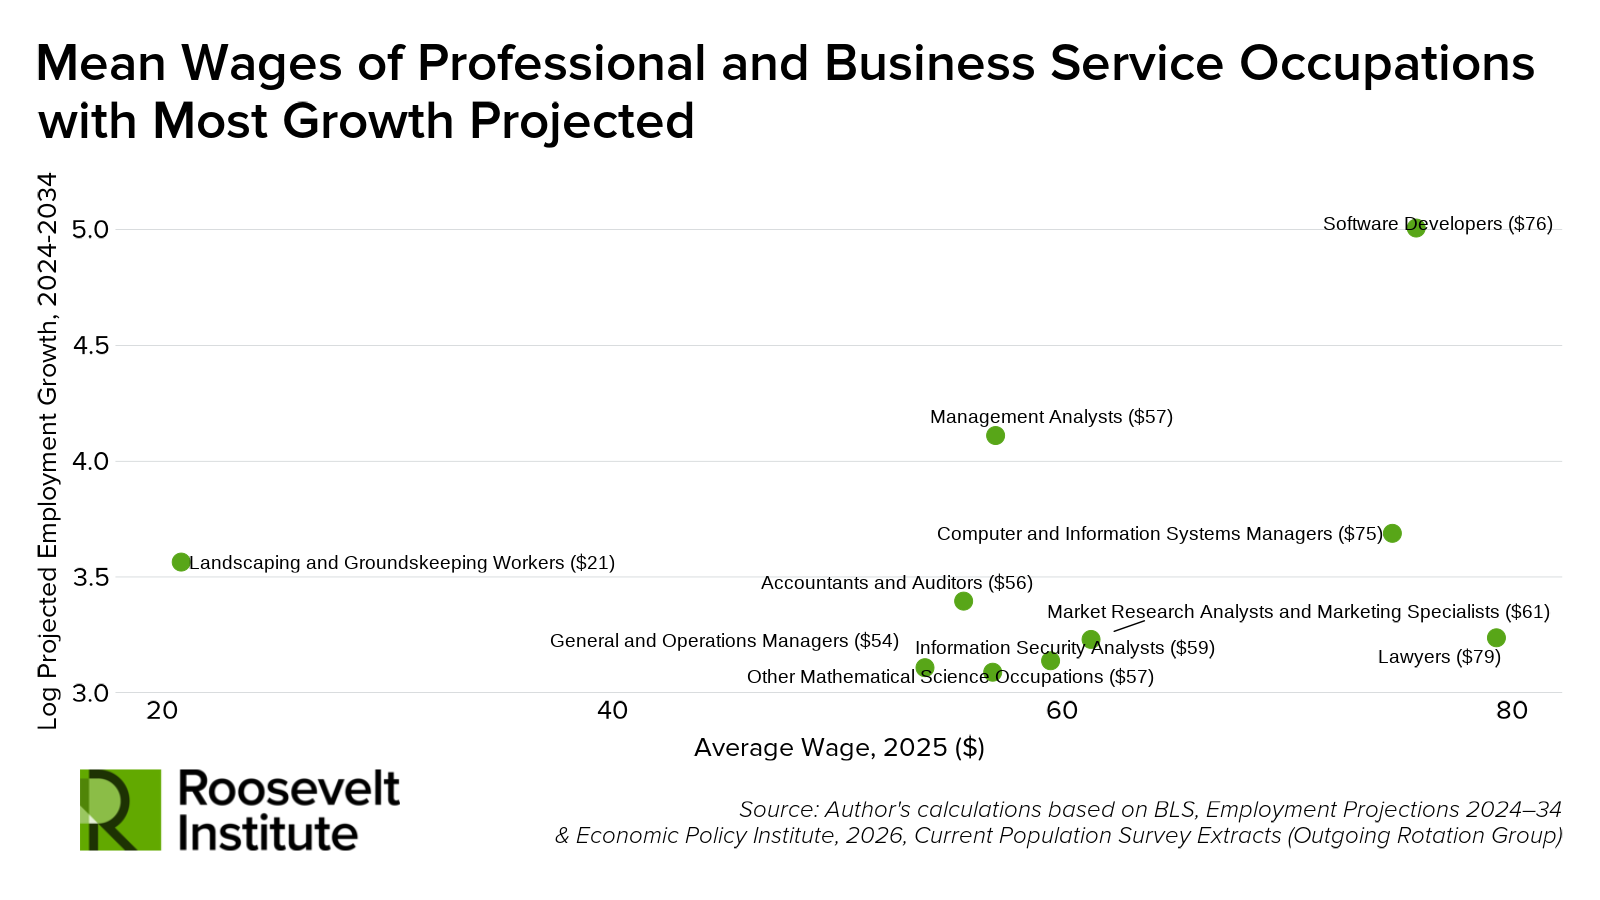
As can be seen in Figure 6 below, the majority of workers in the top growing occupations in this industry have a BA or more. The only occupation in which the majority of workers lack a BA is landscaping and groundskeeping, which as Figure 7 shows pays significantly less on average than all other top growing occupations in this industry. Software developer jobs are projected to grow the most of any job in this industry, with nearly 150,000 jobs added.11 With an average wage of $76 an hour, this occupation pays well above the economy-wide average.
About 49 percent of software developers in professional and business services are white and 38 percent are Asian (Table 5a, Appendix). In 2025, white and Asian software developers in this industry earned an average of $73.97 and $80.39 an hour respectively.12 Men, comprising 80 percent of software developers, earned approximately $78.01 compared to $66.82 for women, amounting to 17 percent more per hour on average.13
Figure 6.
There has been a rapid slowdown in hiring for software developers since 2022, particularly for new labor market entrants. But as Figure 7 shows, this occupation leads the way by a significant margin in projected job gains within the industry.
Figure 7.
c. Leisure and Hospitality
The leisure and hospitality industry is expected to add 686,000 jobs over roughly the next decade. This industry comprises establishments providing arts, accommodations, recreation, hospitality, and food services. The majority of job growth in this industry is in food service–related occupations. Roughly 71 percent of workers within the industry lack a BA, comprising 8.4 percent of all civilian, non-BA workers that are 25 years old or above (Tables 1a and 2a, Appendix).
As shown in Table 4 below, only 25 percent of workers within the industry as a whole have a college degree or higher, a significantly smaller share than in educational and health services. Workers with less than a BA earn average wages of $20.83 an hour, the lowest of any industry.14
Both taken as a whole and among workers with less than a BA specifically, the industry is split evenly between men and women. Among workers with less than a BA in the industry, 45 percent are white and 31 percent are Hispanic (Table 4.1). In comparison to white and Hispanic workers’ shares of the total non-college-educated workforce (54 percent and 25 percent respectively), the former are underrepresented and the latter overrepresented in the leisure and hospitality industry.15
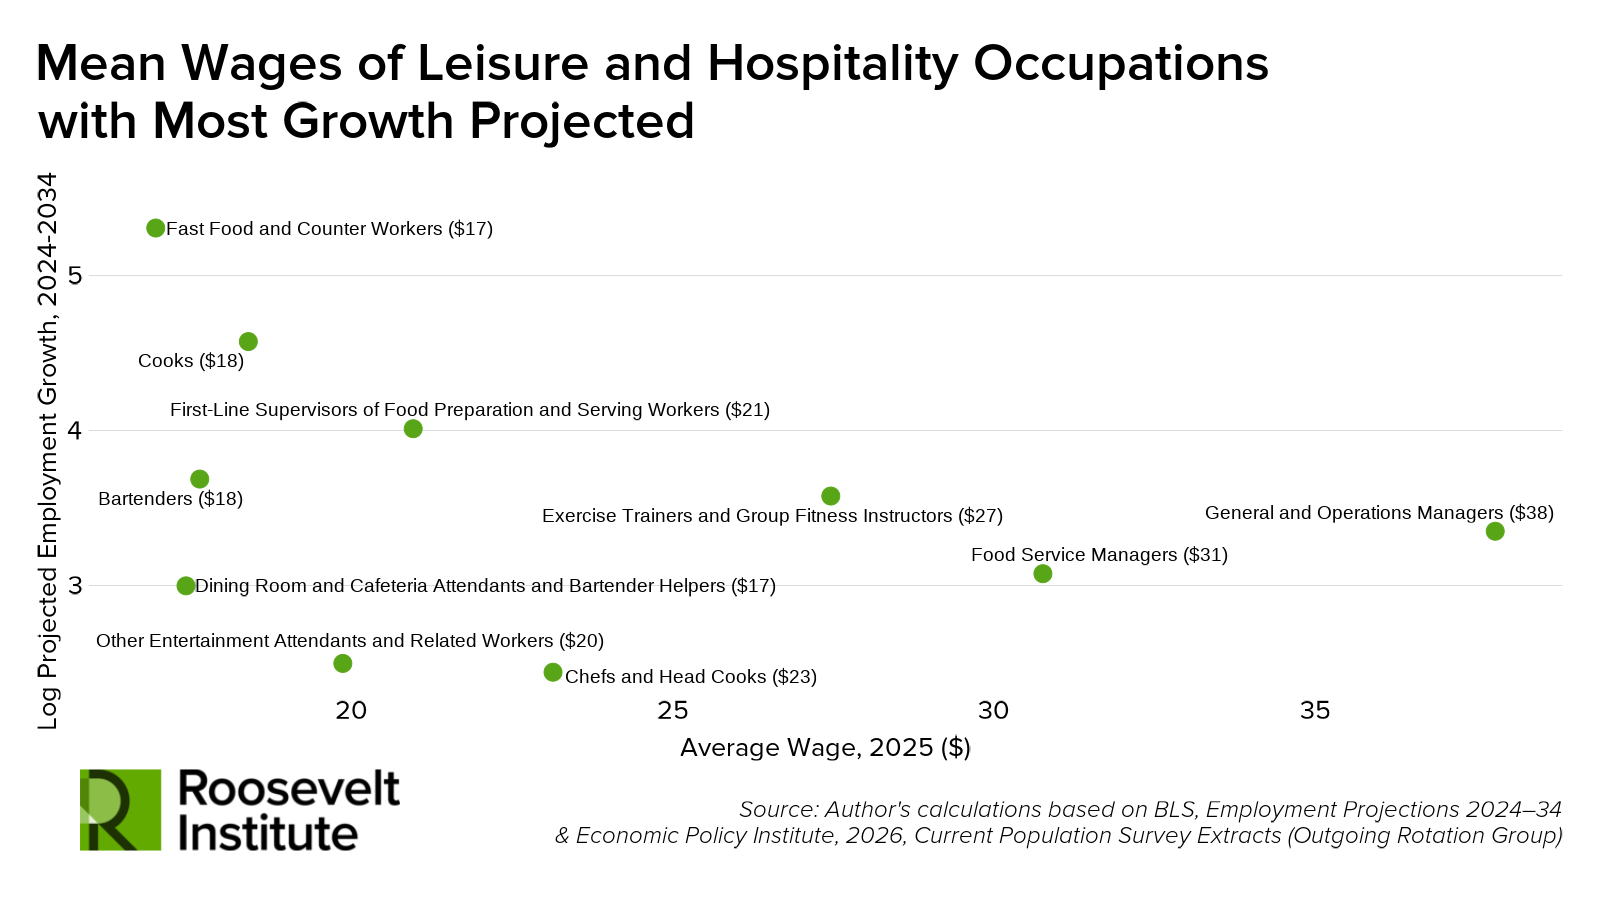
Growth in the leisure and hospitality industry is concentrated primarily in occupations where the majority of workers today lack a college degree, as can be seen in Figure 8 below. Only one of the top ten growing occupations, exercise trainers and group fitness instructors, exhibits a majority share of workers with a BA or more. More than 75 percent of the workers in the top four growing occupations, all food service–related, lack a BA.
Figure 8.
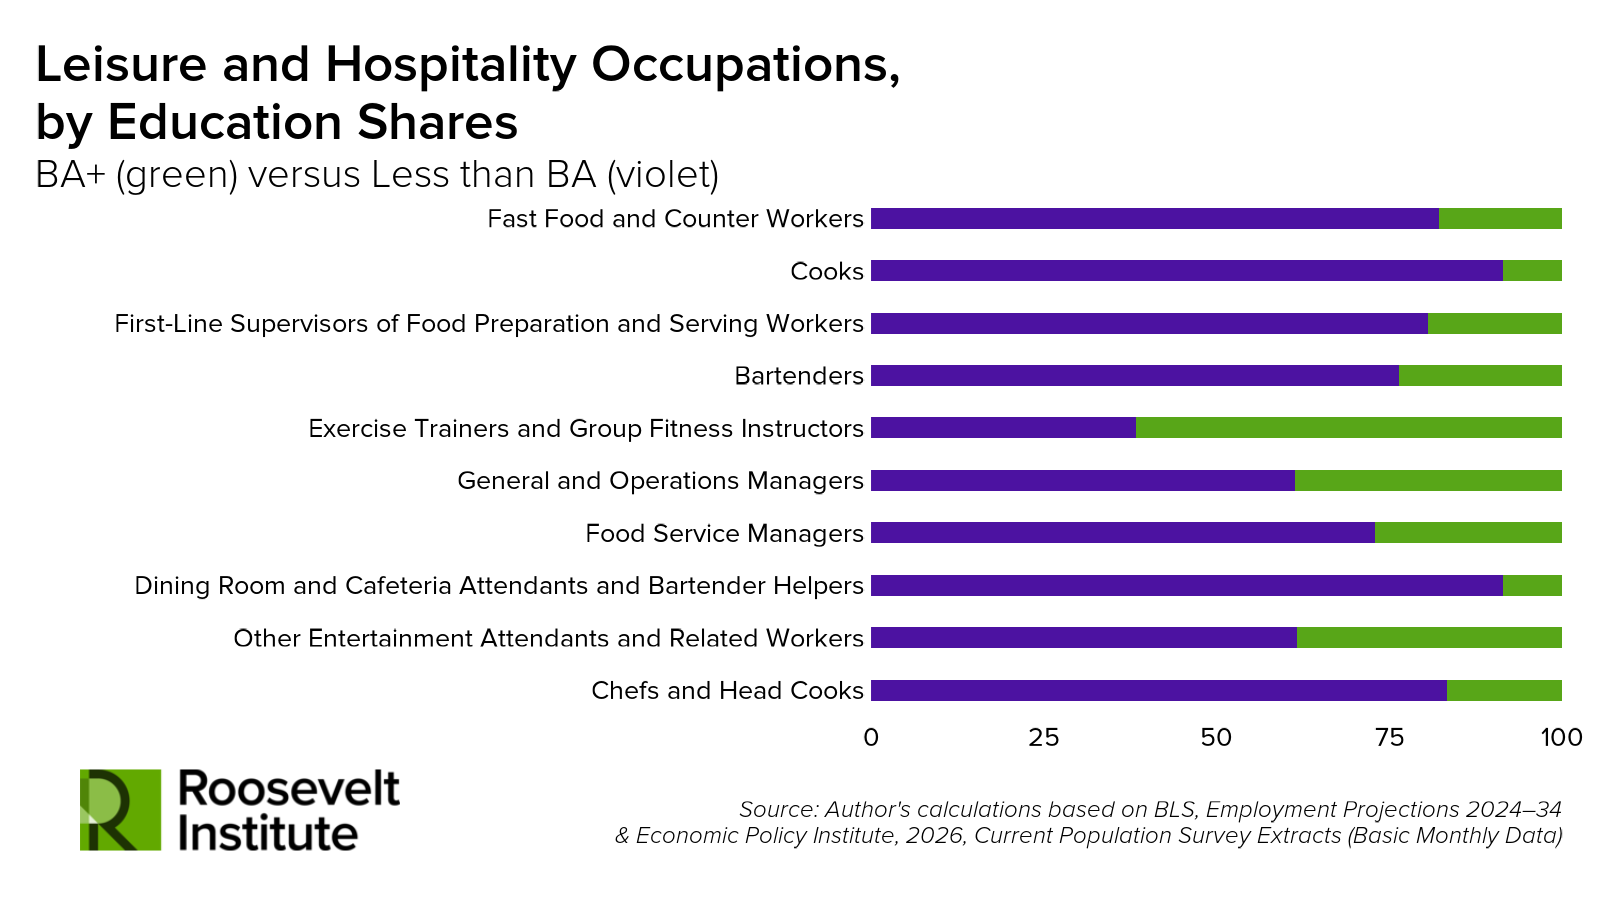
Figure 9 shows that growth in leisure and hospitality is concentrated among lower-pay occupations—even more so than in educational and health services. While half the top growing occupations in the former industry pay more than $40 an hour on average, the highest average wage of any top growing occupation in this industry is $38 an hour. Five out of the ten occupations observed pay $20 an hour or less on average, and seven out of ten less than $25.
Fast-food and counter workers is the occupation expected to grow the most in this industry, adding approximately 200,000 jobs (Table 4a, Appendix). This occupation is 51 percent white, 25 percent Hispanic, and 13 percent Black (a slightly larger share of white workers and smaller share of Hispanic workers than in the industry as a whole).16 Nearly two-thirds, 65 percent, of fast-food and counter workers are women, with men making $2.87 more an hour on average.17
Figure 9.
d. Construction
The construction industry is projected to experience the third-largest amount of job growth, with an anticipated gain of 360,000 job additions by 2034. Growth and employment in this industry is characterized by a high degree of cyclicality, trending in the same direction as broader macroeconomic trends. Furthermore, some high-growth occupations in particular, such as those associated with clean energy infrastructure, will be more sensitive to policy decisions and changes.18 Compared to the workforce as a whole, workers in the construction industry are more likely to lack a BA, to be Hispanic, and to be male. Average hourly wages for non-college educated workers are the third highest of any industry, at $31.81 an hour.
Compared to leisure and hospitality, the construction industry is even more skewed in terms of educational attainment, with less than 20 percent of workers in the industry having a BA. The industry is also highly uneven in terms of gender: Less than 12 percent of all construction workers are women, and among workers with less than a BA that share is only 9 percent. The industry as a whole is 34 percent Hispanic and 56 percent white. Among construction workers with less than a BA, nearly 38 percent are Hispanic and 53 percent are white (Table 5.1).
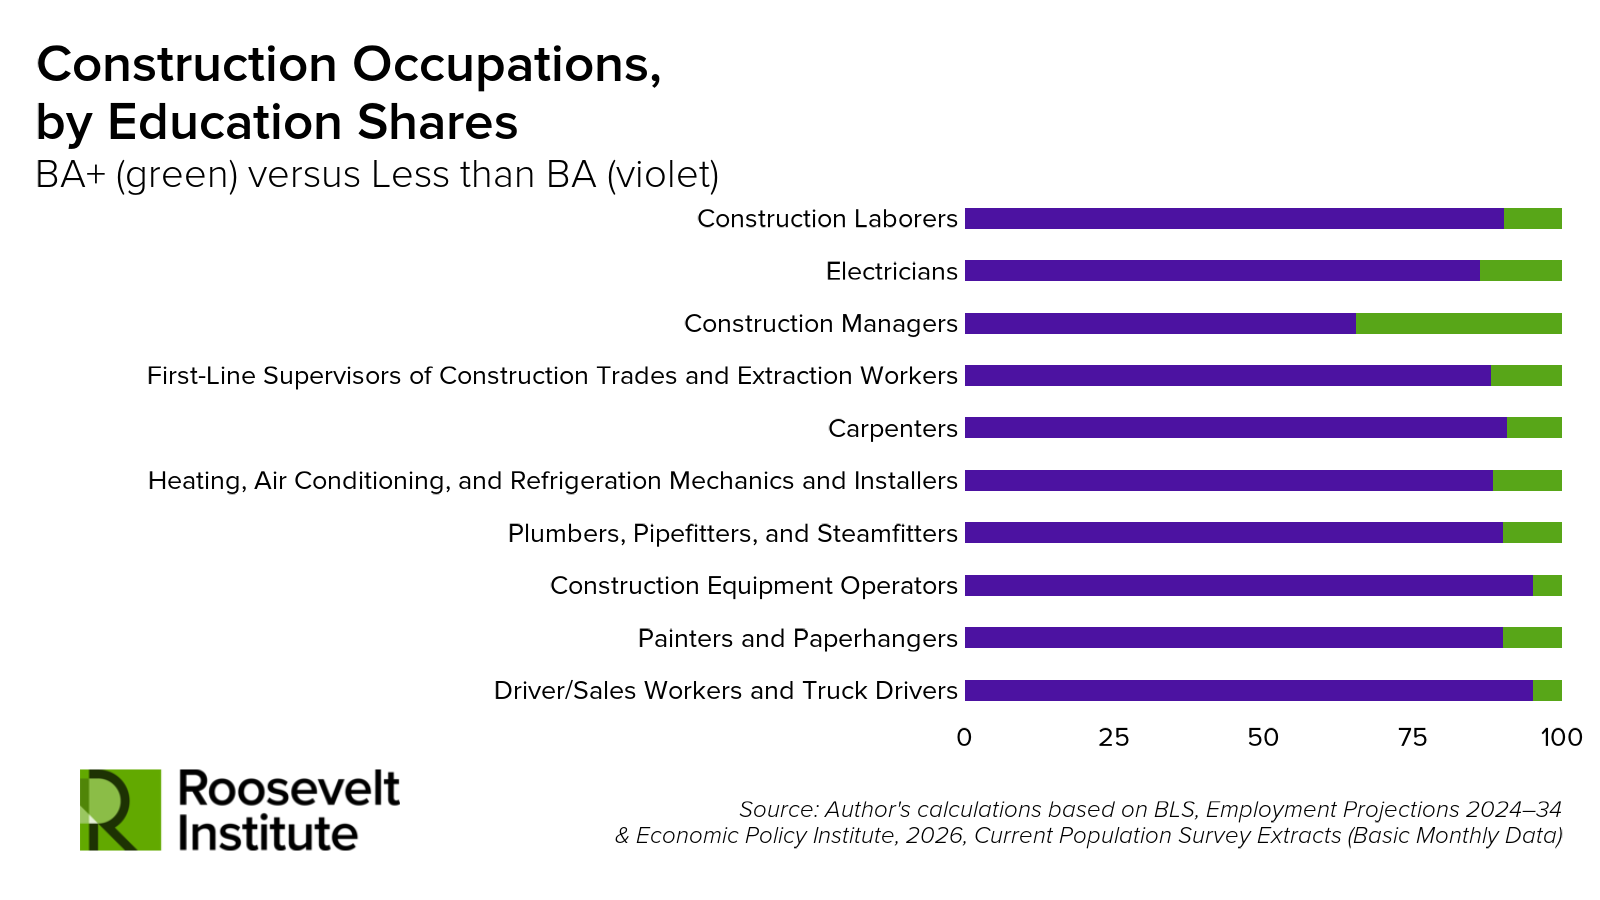
The top growing occupations in this industry are shown in descending order of growth in Figure 10 below. In every occupation group shown, the majority of workers do not have a BA. While construction manager occupations have the highest share of workers with a BA or more, this share remains less than 50 percent.
Figure 10.
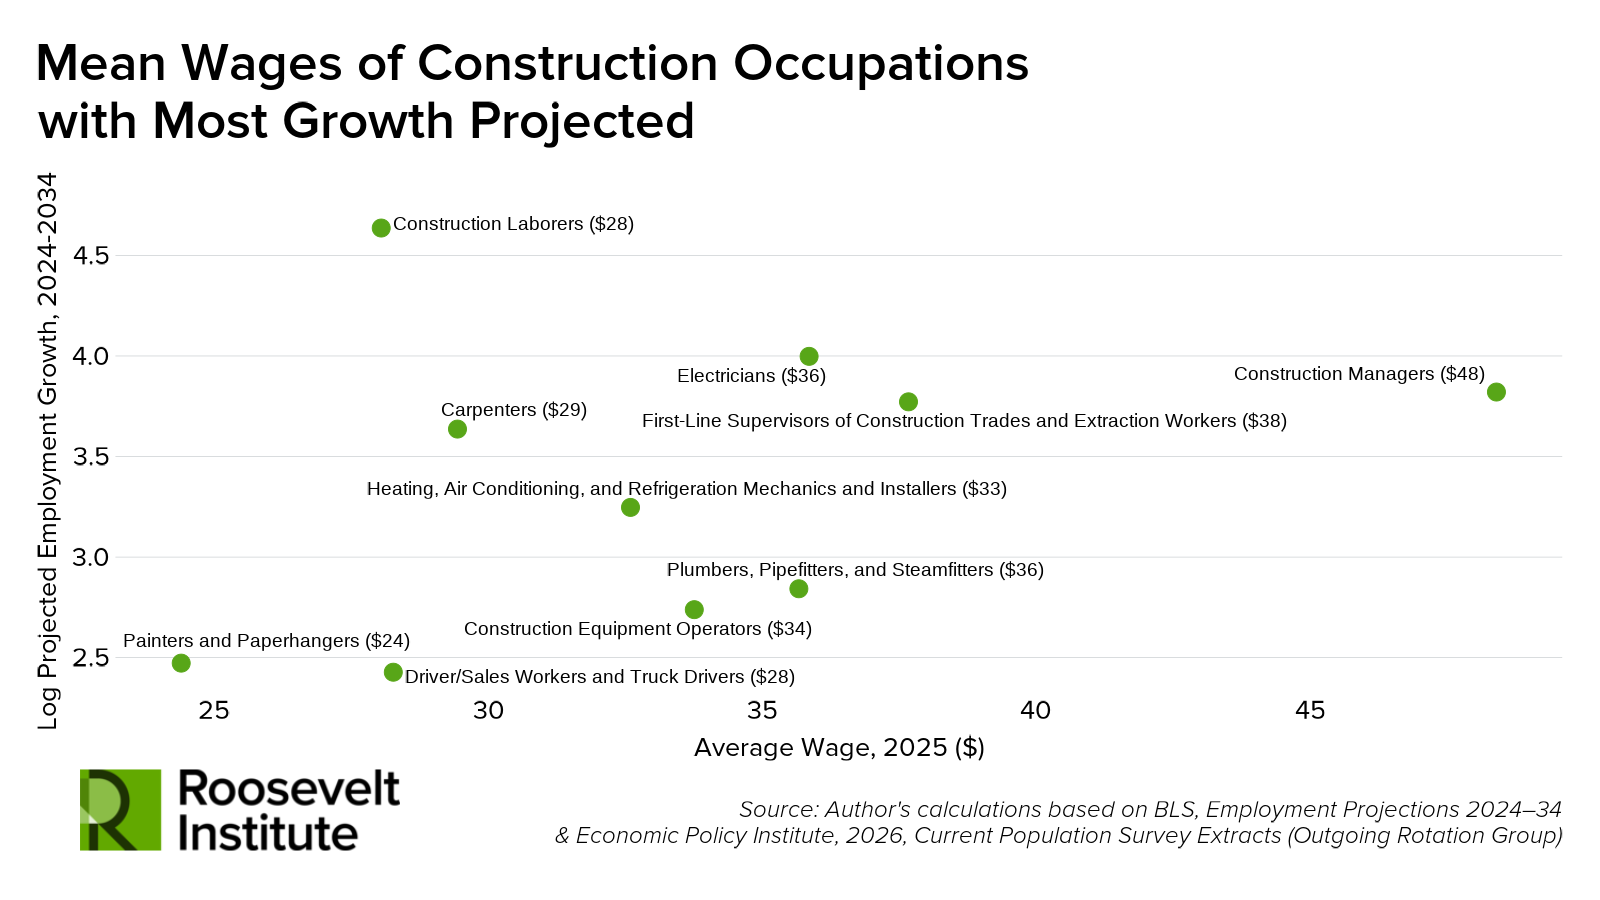
Notably, the relationship between expected growth and current wages exhibits a different pattern in construction than in the previous two industries observed. Occupations are clustered around the center of the wage and log-growth distributions (Figure 11). Furthermore, the three highest-paying occupations fall within the five occupations projected to have the highest levels of growth within the industry.
The number one growing occupation in the industry, construction laborer, is projected to add 103,000 jobs by 2034 (Table 4a, Appendix). These jobs are on the lower end of the average wage scale relative to the rest of the top growing construction occupations, with an average wage of $28 an hour. However, this wage is well above that observed for the fastest-growing occupations in educational and health services or leisure and hospitality.
Construction laborers are 55 percent Hispanic and 35 percent white (Table 5a, Appendix), almost exactly in line with industry averages. White construction laborers earn $5.91 more an hour on average than Hispanic workers in the same occupation (Table 5a, Appendix).
Figure 11.
Conclusion
For workers without a college degree, the majority of projected job growth over the next decade is concentrated in low-wage service occupations. The educational and health services and leisure and hospitality industries account for more than half (52 percent) of projected job gains from 2024–2034. This ongoing industrial transformation is reflective of an aging population as well as a growing prevalence of chronic health issues, particularly among jobs that provide health-care and related services.
Within these high-growth service industries, the largest job gains will be in occupations that pay less than $20 an hour. These occupations—home health and personal care aides and fast-food and counter workers—are currently performed by a predominantly female and disproportionately non-white workforce. Well-designed, pro-worker economic policies that target these low-wage occupations—supporting employment, wage growth, and worker bargaining power—are in turn policies that should strengthen the economic position of the diverse marginalized groups that comprise significant shares of this labor force.
How these projections actually materialize and what they will mean for the affected workers is not a process set in stone by deterministic economic laws.19 Whether these growing industries remain low-wage is a matter of political choice and the distribution of economic power. Empowering workers in these industries to bargain collectively, keeping full employment as a policy North Star, raising the minimum wage, and investing in public care options are just some of the ways that policymakers can transform the experience of workers in the sectors discussed above. Educational and health services are the backbone of our economy and society, and leisure and hospitality jobs must not be sidelined and devalued as they have been for so long. These are the workers who make up our economy, and these growing industries must provide their workers with the building blocks of a good life.
Appendix
Footnotes
- In 2021 and 2022, tight labor markets seemed to be reversing the trend toward increasingly widening income inequality. However, this reversal was all too brief, and furthermore remained sensitive to how earnings were measured. ↩︎
- Industries refer to the classification of establishments according to their output or activity—e.g., manufacturing, construction, or educational and health services. Different classification systems for industries are provided by the North American Industrial Classification System (NAICS) and the US Census Bureau. At the highest level these include categories like manufacturing, wholesale and retail trade, and agriculture. Each one of these high-level major industry groups contain numerous levels of subcategories, all the way down to the smallest level, which includes activities like “Dog and Cat Food Manufacturing,” “Used Car Dealers,” and “Soil Preparation, Planting, and Cultivating.” Occupations refers to the classification of workers according to the activities performed and the skills or credentials required to do so—eg., “Nurse Practitioners,” “Cooks,” and “Data Scientists.” The BLS reports occupation groups according to both the National Employment Matrix and Standard Occupation System codes. ↩︎
- Author’s calculations based on converting NAICS classifications to census industry classifications. This brief uses CPS 2003 Major Industry classification rather than BLS NAICS classifications. Figures drawn from US BLS, Employment by Major Industry Sector, Table 2.1. ↩︎
- These figures derive from the BLS’ Occupational Employment and Wage Statistics database. For the majority of this brief, wages statistics will be derived from the Current Population Survey Outgoing Rotation Group microdata. Using this latter data, the average civilian wage was $35.30 an hour in 2025. For civilian workers aged 25 and over—the primary group of workers considered throughout this brief—it was $37.79. ↩︎
- All workforce statistics in this brief are for civilian workers, age 25 and over. Unless otherwise specified, all wages are drawn from CPS Outgoing Rotation Group (ORG) microdata for 2025, and all workforce shares are drawn from CPS Basic Monthly microdata using a three-year average from 2022–25. ↩︎
- Wholesalers sell goods or services to other businesses while retailers sell to the general public. ↩︎
- The BLS estimates an additional 739.8 thousand home health and personal care aides jobs over the next ten years. Given the current distribution of employment in this occupation across industries, this translates to an addition of 608,000 home health and personal care aides jobs within educational and health services (Table 4a, Appendix). While it is unlikely that the occupational distribution of employment across industries will remain stable over the next 10 years, this correction avoids falsely attributing all projected occupational growth to any single industry observed. ↩︎
- Authors calculations from CPS Basic Monthly Data, Table 5a in Appendix ↩︎
- Figures 5 and 6 are ordered in descending order according to the amount of job growth. See Tables 19 and 20 in Appendix for reported occupation job growth estimates, mean wages, and demographic shares. ↩︎
- Table 3a, Appendix ↩︎
- 267,700 software developer jobs are projected to be added to the economy total. Based on three-year average shares from 2022–25, 55 percent of workers in this occupation are classified as working in the professional and business services industry, hence 149,000 jobs allocated to growth of this occupation in this industry specifically. (Table 4a, Appendix) ↩︎
- Table 5a, Appendix ↩︎
- Table 5b, Appendix ↩︎
- Appendix Table 3a ↩︎
- Author’s calculations from CPS Basic Monthly Data using three year pooled average from 2022 to 2025, Table 3b in Appendix ↩︎
- Author’s calculations from CPS Basic Monthly 2022-2025, Table 5a in Appendix ↩︎
- Author’s calculations from CPS ORG 2025 and CPS Basic Monthly 2022-2025, Table 5b in Appendix ↩︎
- While growth projections for 2023–2033 are explicit in presuming that policy-augmented growth in clean energy will drive construction growth, it is not completely clear whether the rollback of the Inflation Reduction is factored into the 2024–2034 projections. ↩︎
- As the BLS acknowledges, they do not project policy change: “Changes in governmental policy can affect demand for occupations and industries. Factors such as funding levels, tax incentives, and regulations can alter employment demand patterns. While there will undoubtedly be changes to these over a 10-year period, BLS does not project policy change—instead, projections are based on current law.” ↩︎
Acknowledgments
The author would like to thank Patrick Oakford, Suzanne Kahn, Michael Madowitz, Aastha Uprety, and Liz Olson for their feedback, insights, and contributions to this paper. Any errors, omissions, or other inaccuracies are the author’s alone.
Suggested Citation
Dye-Furstenberg, Oskar. 2026. “Who Makes Up the Labor Force?: Projecting Workforce Growth over the Next Decade.” Roosevelt Institute, May 12, 2026.